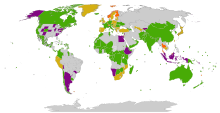
Problem: World maps are a useful means to provide a quick overview in many articles. However, a minority of users are skilled to create and update such maps. Example of a map that regularly needs to be updated (plastic bag laws)
Proposed solution: It would be handy to have an extension (similar to e.g. Graph or EasyTimeline) for world maps. It would need be possible to assign a color to each country (using codes such as USA or ITA).
Who would benefit: Users who don't have SVG editing skills; readers who are shown world maps (that would otherwise not exist).
More comments: It would make it easier and quicker to create and updated such maps compared to editing SVG files. Examples of the types of maps that could be created and updated using such an extension are found in e.g. Category:SVG political maps of the world.
So it should be updatable by visually taking at the map and draw lines of data, and it would be automatically updated into the source code. Thingofme (talk) 00:40, 20 January 2022 (UTC)[reply]
I am aware of this tool. However, this would not really solve the issue. AFAIK, there is no possibility to load the current map into that tool in order to make an update (e.g. to change the color of one state/country), i.e. each time one would need to start from the scratch. Moreover, there are many tiny countries that are not easily found and clicked in such a graphical interface. --Leyo (talk) 09:00, 20 January 2022 (UTC)[reply]
Hello Leyo & SWilson (WMF), the issue with updating countries on maps pops up regularly in the Map workshop requests. I agree that for a non experienced user a simple change of color of a county on a svg map is impossible. I can suggest two solutions:
allow upload of css files associated to svg maps. This may be not very convenient but is still easier to update a text file with a country ISO code. A graphical tool to change these codes may help. I proposed this solution previously with the aim to reduce the size of maps as the svg picture of the borders is the same for all maps and only colors change.
create a graphical tool as proposed earlier by SWilson. I agree with Leyo that the SVG Map Maker tool is not the most convenient. I worked on a similar tool here. that allows to adapt any map from Commons and update it. I still work on it but I tried with few maps and it works quite fine. The only condition is to adapt slightly the svg maps by adding a specific class name to the elements representing shapes of countries to be colored.
By the way the tool I created can provide more than just coloring countries but also some basic pie charts, waffle charts or bubble charts. Otherwise this tool in Wikipedia may be used to color code countries on map. --Ikonact (talk) 21:07, 20 January 2022 (UTC)[reply]
Thank you. I wasn't aware of Template:Graph:Map. This is nearly what I was proposing. It has, however, one major drawback: As opposed to an image, there does not seem to be a possibility to add a thumb version of it to an article, whereas the full version is only shown when clicked on. --Leyo (talk) 22:59, 20 January 2022 (UTC)[reply]
I very much recognize this need, I've been trying to push for it inside WMF for a while. Two pieces of context might help. Graphoid was recently decomissioned and there's a stalled effort to bring it back online. This would allow us to render thumbnails to fix the problem @Leyo mentions above. On a parallel track, there's hope that the visualization components we built for Wikistats 2 will be upstreamed to Wikimedia Codex, the new standard design system that we'll use for UI going forward. I just hope we can connect one or both of those efforts to this very real need. Milimetric (WMF) (talk) 13:40, 3 February 2022 (UTC)[reply]
Strong support I can make and update maps using Inkscape and some text editing, but having this automatable through structured data would be amazing. OwenBlacker (Talk) 10:57, 30 January 2022 (UTC)[reply]

 Support Vis M (talk) 21:14, 28 January 2022 (UTC)
 Strong support I can make and update maps using Inkscape and some text editing, but having this automatable through structured data would be amazing. OwenBlacker (Talk) 10:57, 30 January 2022 (UTC)
 Oppose --Ciao • Bestoernesto • ✉ 17:12, 6 February 2022 (UTC)