Visualizing sustainability and climate change
| Visualizing sustainability and climate change on Wikipedia | Project | Activities | DMP | Documentation | Credits |
Visualizing Sustainability and Climate Change is a project visualizing knowledge gaps related to sustainability and climate change on Wikipedia. The project aims at measuring the knowledge gaps, supporting the communities in improving content related to this specific topic, facilitating collaborations among multilingual communities and partners, and strengthening the capacity of Wikipedia communities to document sustainability and climate change, and to inform about it. Practically, in collaboration with sustainability and climate change Wikimedia projects, it produces a visual tool which allows to evaluate and monitor the quality and quantity of articles related to sustainability and climate change on Wikipedia in different languages.

Keywords
editInformation design
Sustainability
Climate change
Visualizing Wikipedia articles
Team
editThe proposal is promoted by SUPSI in collaboration with Wikimedistas de Uruguay and it is designed in synergy with the numerous current projects related to sustainability and climate change within the Wikimedia and the Open movement.
| Name | Pronouns | Role | Payment | Affiliation | Country | Biography | Experiences in the related field |
|---|---|---|---|---|---|---|---|
| Dr. Iolanda Pensa (iopensa) | She/her | Principal investigator | None | SUPSI | |||
| Evelin Heidel (scann) | None | Wikimedia Uruguay | |||||
| Dr. Giovanni Profeta (G.prof) | designer | Staff | SUPSI |
Vision of the institutions involved and related experiences
edit| Institution | Description - Vision and overview | Relevance of the proposal | Experiences in the field of Climate Change Visualizations |
|---|---|---|---|
| SUPSI - University of Applied Sciences and Arts of Southern Switzerland, Department for Environment Constructions and Design, Institute of Design | The Institute of design at SUPSI produces applied, use-inspired and creative research. Its research focuses on interaction design, information design, open data, Open Science, valorization of archives, experimental tools for education, Wikipedia and open licenses and tools. | The proposal contributes to the research of the Institute of design and it is connected to previous experiences in designing tools which can support online communities in contributing to improve the quality and quantity of thematic | Iolanda Pensa and Giovanni Profeta have specific experiences as researchers and volunteers in designing and implementing visualizations of the Wikimedia projects.
|
| Wikimedistas de Uruguay | Wikimedistas de Uruguay has been working on climate change & sustainability in the Spanish speaking context, helping set up the Wikiproyecto Cambio climático, and assisting with the organization of the Wii 4 Human Rights Campaign in the LATAM context. | ||
| Project Climate Change in Latin America | |||
| Open Climate Campaign | Over the next 4 years, the Open Climate Campaign will be working hard to make open sharing research outputs the norm in climate science (2022-2026). The Open Climate Campaign is a partnership between Creative Commons, SPARC and EIFL with the support of Open Society Foundations and Arcadia – a charitable fund of Lisbet Rausing and Peter Baldwin. |
The team at SUPSI has been designing and implementing visualizations related to Wikimedia content since 2012.
- Wikipedia e scuola italiana, 2020-2021. A series of visualizations to analyse and monitor articles related to the Italian school. The visualizations has been used to organise quality festivals on Wikipedia to trigger the improvement of the articles. In 2020 the visualisations produced an overview of content. In 2021 the visualizations were available online, highlighting what changed between 2020 and 2021. Principal investigator Iolanda Pensa (volunteer, project promoted by Wikimedia Italia), visualizations by Giovanni Profeta.


- Visualisations produced during the Workshop Wikidata SUPSI, 2017. A series of visualizations to monitor and understand knowledge gaps based on Wikidata. Project lead Iolanda Pensa in collaboration with Serena Cangiano, visualizations by Marco Lurati and Giovanni Profeta.


- GLAM visual tool, 2017. A visual tool to monitor the engagement and impact of galleries, libraries, archives and museums (GLAMs) cooperating with Wikipedia, the Wikimedia projects and open licenses. Principal investigator Iolanda Pensa, visualizations by Giovanni Profeta. Supported by Wikimedia CH.


- Visualizations produced to monitor, evaluate the project Wikipedia Primary School, 2014-2017. A series of visualizations to monitor the quality of content related to primary school is available on Wikipedia and the impact of the project Wikipedia Primary School in improving this content. Principal investigator Iolanda Pensa, visualizations by Giovanni Profeta.


- DensityDesign Research Lab for Share Your Knowledge, 2012. A series of visualization made to understand the impact of the project Share Your Knowledge in supporting the cooperation between galleries, libraries, archives and museums (GLAMs) with Wikipedia, the Wikimedia projects and open licenses. Project lead Iolanda Pensa (affiliated by Moleskine Foundation, previously lettera27 Foundation).


Short literature review
editFor around ten years, multiple researchers have been conducted around the use of the visualization of Wikipedia data to analyze the content produced by the community as a social phenomenon.
It was shown that data visualization can make it possible to map disputes [1] and controversies[2] on Wikipedia. The visualization also provides the community with a tool to understand the status of the articles. In this context, several visual analytics researches highlight content imbalance across linguistic versions[3], genders[4], and cultures[5].
Researches that visually try to map the knowledge gap in Wikipedia are essentially based on the monitoring of the article quality[6], the active involvement of the community[7], and the generation of guidelines to support the community to foster equity and diversity[8].
Envisioned Change
editOpportunities
editSustainability and Climate change
edit- Sustainability and climate change are important topics at an international level. They are important for governments, international agencies and NGOs, societies, citizens and for many active people across the globe.
- Wikipedia is a powerful source of information and its content is widely read, cited and reused. It is important to provide accurate, complete and balanced information in as many languages as possible on this topic.
- There are already groups and projects in different languages on Wikipedia focusing on sustainability and climate change and designed to support the improvement of quantitative and qualitative content related to it.
- The issue of climate change is strongly connected to the issue of sustainability, a key element of the Wikimedia Strategy 2030 (Increase the Sustainability of Our Movement/Align our practices to support environmental sustainability).
- Sustainability and climate change are topics for impact (part of the Wikimedia Strategy 2030 - Identify Topics for Impact)
Visualizations
edit- Visualizations are a powerful communication tool.
- Visualizations allow to analyse and interpret large quantity of data.
- Wikidata provides access to a large quantity of data connected among projects and external sources. Those data can be interpreted through visualizations.
- Visualizations are potentially an innovation in free knowledge (part of the Wikimedia Strategy 2030 - Innovate in Free Knowledge)
- Visualizations are able to portray the state of the art of the current state of Wikipedia articles. Multiple visualizations that are made over a certain period can make the evolution of articles visible.
Challenges
edit- It is difficult to grasp the situation on Wikipedia related to a topic; we have lots of information on specific articles but it is difficult to assess the status of a topic.
- The communities work often isolated within their linguistic projects
- Knowledge gaps need to be identify and communicated to activate communities and partners to engage with those gaps.
- Communities need to be supported with tools which can allow them to identify relevant content which can be improuved. The support is important to facilitate collaborations among projects in different languages and to trigger the involvement of partners
Change we want to see (outcome)
editWe want communities to have a tool which can allow them:
- to analyse and monitor topics on Wikipedia
- to support their contribution
- to allow them to communicate their work.
We expect that a visualization tool to be the most efficient to support the communities and provide them with a designed communication tool. We focus on sustainability and climate change as relevant and important topics with existing projects, institutions, individuals and communities already engaged.
Strategy and Approach
edit| Strategy | Why this strategy will be effective | Learning questions |
|---|---|---|
| Designing and developing a visualization tool about Wikipedia articles related to climate change and sustainability in 3 languages and documenting 2 periods of time | Visualizations are tools which allow to analyse and monitor content on Wikipedia, |
|
| Testing the use of those visualizations to communicate topics to communities and partners | Visualizations are tools which can support the communities in understanding which content needs to be improved, which are the priorities and where they can find sources and other articles to use, adapt and translate. The link among Wikipedia projects in different languages also allows to reinforce the collaboration among multilingual projects and partners |
|
| Collaboration with the Wikimedia projects about sustainability and climate change to communicate their work | Visualizations are communication tools which allow to report the status of a specific content on the Wikimedia projects and how the communities have improved it over time. |
|
The visualization tool provide information related to:
- Article status
- Number of images in existing articles
- Number of reference in existing articles
- Number of template messages (maintenance tags, cleanup tags, cleanup messages) in existing articles
- Dimension of the summary of existing articles
- Dimension of the discussion page of existing articles
- Number of months the articles has been existing (date of creation)
- Articles existing in other languages (and on existing articles)
- Contributions and engagement
- Number of contributors engaged in the article (excluding bots)
- Number of visualization of the existing articles
The visualization tool will provide the following features:
- Ordering the existing articles according to visualizations, issues, dimension of the summary
- Show the articles change from period 1 to period 2: article status, contributions and engagement with a report per language
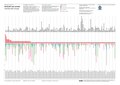
Examples of visualisations produced to analyse, improve and monitor articles related to the Italian school
Activities
editThe project consists of the following activities:
- Identifying articles about sustainability and climate change based on Wikimedia multilingual projects (and add a specific category)
- Collecting data about the articles in different languages (Spanish, English, Italian, and German) through the use of Wikipedia and Wikidata API
- Designing and developing of a visual tool to display articles data. The tools features the following charts
- a scatterplot that shows the articles' status and engagement
- a network that shows the connections among articles in terms of wikilinks
- a page that shows the contributors of the articles
- Gathering feedback from the communities about the data visualizations
- Using of the visualization for a pilot event
- Gathering feedback from the participant of the pilot event
- Automatizing the data gathering of sets of Wikipedia articles in different languages
- Writing of a report on the tool and further developments
Timeline
editThe project lasts 12 months. It starts 1 February 2023 and it ends 31 January 2024
| Activity | People involved | Hours | 1 | 2 | 3 | 4 | 5 | 6 | 7 | 8 | 9 | 10 | 11 | 12 |
|---|---|---|---|---|---|---|---|---|---|---|---|---|---|---|
| Identifying set of articles | community manager | 120 | x | x | ||||||||||
| Collecting data | designer | 80 | x | |||||||||||
| Design and development of the data visualizations | designer, developer | 120 | x | x | ||||||||||
| Gathering feedback from the communities | community manager | 80 | x | x | ||||||||||
| Coordination of the pilot event | community manager | 80 | x | x | ||||||||||
| Gather feedback about the pilot event | community manager | 24 | x | |||||||||||
| Automatize the data gathering | designer, developer | 80 | x | x | ||||||||||
| Write the report | community manager, designer | 20 | x | |||||||||||
| Total | 604 |
Impact and relevance to Wikimedia projects
editOnly in 2021, across several language Wikipedias, articles on climate change and sustainability received over 324 million pageviews; there are over 26,000 articles on the topics across all languages wikis. In a world where the climate crisis gains traction in the media, mobilizes youth and gains the attention of international agencies, NGOs and governments, having access to reliable, up to date, quality information is crucial.
The Wikimedia community has recognized the importance of the topic early on, with experiences such as the Wiki for Human Rights campaign mobilizing around the topic of the Right to a Healthy Environment; the Wikiproject Climate Change being replicated in multiple language Wikipedias, including English, Spanish, French and more; with user groups, such as Wikimedians for Sustainable Development, beginning to organize to drive more attention on the topic. In 2021, over +70 community events had climate change and sustainability as the core topic of their activity.
However, it is still complicated to measure how well we are covering the topics across multiple language Wikipedias and to tell a compelling story to outside partners on why contributing to Wikipedia on these topics matters so much, and what yet remains to be done. So far, most of the campaigns manually curate lists of articles every time, going through article by article to assess quality, and often without being able to easily compare across different language Wikipedias.
This project aims to support the different groups and projects across languages to easily identify the quantity and quality of content related to sustainability and climate change. We expect that through the development of the tool we will be able to implement automatic data gathering for different sets of articles, allowing the community to analyze any topic in Wikipedia with the visual tool.
This applied research responds to the needs of multilingual Wikimedia communities by providing them with a relevant tool designed and tested collaboratively.
Specifically connected to the Wikimedia 2030 Movement Strategy the project contributes to:
- Innovate in Free Knowledge (Create tools and partnerships to facilitate bringing content from other data and knowledge bases to our projects): by using information design and visual tool to support the communities
- Identify Topics for Impact: by contributing to the topics of sustainability and climate change which are already considered by the communities "topics for impact"
- Coordinate Across Stakeholders: by facilitating the cooperation among institutions and individuals interested in improving mainstream knowledge about sustainability and climate change.
- Evaluate, Iterate, and Adapt: by providing the communities with a visual tool which contributes to monitor and evaluate the impact of the Wikimedia communities in documenting and improving specific topics on the online projects.
- Invest in Skills and Leadership Development: by supporting access to research data through an easy and communicative visual tool, which allows a broader community to benefit from research and data analysis.
Content knowledge gaps
edit- The project allows the Wikipedia community to identify the articles, information, images and links that are missing
- The project allows allow the Wikipedia community to visually analyze the quality of the Wikipedia articles related to sustainability and climate change
Participation
edit- The tool will allows the Wikipedia Community to apply the data visualization to different sets of articles belonging to a topic
- By providing an interactive thank you web page with the name of the contributors, the project fosters the contribution by the community
Dissemination
editThe project will be presented to the Wikipedia community through the Wikimedia groups working in the fields of Sustainability and Climate Change. The whole project will be documented through a Wikimedia Meta page and the tool will be presented through a public online event.
Furthermore, a paper regarding the design and development of the visual tool will be published in a journal about digital humanities.
Selection criteria
edit| Selection criteria | |
|---|---|
| Relevance | |
| Impact | |
| Geography of the applicant and their corresponding institutions | |
| Community | |
| Prior contributions to related academic and/or research projects and/or the Wikimedia and free culture communities. |
Budget
edit$49,500
The budget supports the costs of a community manager, a designer, a developer and a coordinator. The budget includes 15% overhead.
The community manager identifies the sets of articles in multiple languages and gathers related data, collects needs and feedback from the communities through two surveys and organizes a test of the tool and collects feedback; the designer with the developer designs and develops the data visualizations and they automatize the data gathering for different sets of articles. The coordinator guarantees the management of the project and its reports.
Notes
edit- ↑ E. Weltevrede, and E. Borra. (2016). “Platform affordances and data practices: The value of dispute on Wikipedia,” Big data and Society, 3(1)
- ↑ C. Pentzold, E. Weltevrede, M. Mauri, D. Laniado, A. Kaltenbrunner, and E. Borra. (2017). “Digging Wikipedia. The online encyclopedia as digital cultural heritage gateway and site,” Journal of Computation and Cultural Heritage, 10(1), 5:1–5:19.
- ↑ Ribé M. M, Laniado D. (2018) "Wikipedia Culture Gap: Quantifying Content Imbalances Across 40 Language Editions" in Frontiers in Physics.
- ↑ Beytía, Pablo & Agarwal, Pushkal & Redi, Miriam & Singh, Vivek. (2021). Visual Gender Biases in Wikipedia: A Systematic Evaluation across the Ten Most Spoken Languages. 10.31235/osf.io/59rey.
- ↑ Zheng, Xiang, et al. "Gender and country biases in Wikipedia citations to scholarly publications." Journal of the Association for Information Science and Technology (2022).
- ↑ Nathan Teblunthuis. 2021. Measuring Wikipedia Article Quality in One Dimension by Extending ORES with Ordinal Regression. In Proceedings of the 17th International Symposium on Open Collaboration (OpenSym '21). Association for Computing Machinery, New York, NY, USA, Article 5, 1–10. https://doi.org/10.1145/3479986.3479991
- ↑ Isabelle Langrock, Sandra González-Bailón, The Gender Divide in Wikipedia: Quantifying and Assessing the Impact of Two Feminist Interventions, Journal of Communication, Volume 72, Issue 3, June 2022, Pages 297–321, https://doi.org/10.1093/joc/jqac004
- ↑ Núria Ferran-Ferrer, Marc Miquel-Ribé, Julio Meneses, and Julià Minguillón. 2022. The Gender Perspective in Wikipedia: A Content and Participation Challenge. In Companion Proceedings of the Web Conference 2022 (WWW '22). Association for Computing Machinery, New York, NY, USA, 1319–1323. https://doi.org/10.1145/3487553.3524937