Research:GLAM visual tool
Giovanni Profeta
Iolanda Pensa (principal investigator)
GLAM visual tool is a research project developed by the Laboratory of visual culture at University of Applied Sciences and Arts of Southern Switzerland (SUPSI) and supported by Wikimedia CH.
The research project focussed on the visual elements of a statistical tool developed to monitor the cooperation between GLAMs and the Wikimedia projects. More specifically
- it produces three interactive visualizations
- it produces the front end of the tool
- it suggests visualizations which can support the cooperation between GLAMs and the Wikimedia projects
Agreement with Wikimedia CH
edit"We are very pleased for the support you are granting us in developing within the frame of the Laboratory of visual culture the applied research GLAM visual tool. Our work will focus on the visual identity of a statistical tool meant to provide information related to the capacity of GLAMs (galleries, libraries, archives and museums) in contributing to open knowledge and in particular to Wikipedia and the Wikimedia projects. We will test and develop the front end of a website proving access to the data and a series of visualizations to interpret data and support evaluation and decision making in accordance with the requirements described in the document Requirements Version 2.0 September 12, 2016 and with a specific focus in researching solutions which can enhance GLAMWiki cooperation. The research team will provide furthermore a working day for training and testing of the release.
- Title of the applied research: GLAM visual tool
- Duration: November 2016 - March 2017 - 5 months
- Research team: Iolanda Pensa (principal investigator) and Giovanni Profeta
- Copyrights: Wikimedia CH, SUPSI, and all the authors will own all non exclusive rights on all the content, tools and data produced; all the project documentation will be released by default under cc by-sa. Report: by 60 days from the end of the project.
- Support from Wikimedia CH: 15’000 chf with two installments - by 15 November 2016: 10’000 chf - by 31 January 2017: 5’000 chf
Please note that as soon as we receive this agreement signed, our administration will produce a bill for the agreed amount plus 8% VAT."
Methods
edit
The project uses information design to evaluate, monitor and trigger partnerships between GLAMs and the Wikimedia projects. Furthermore the project uses information design to trigger new ways of evaluating cultural institutions and their impact.
This project is an independent research developed by the Laboratory of visual culture meant to contribute to a statistical tool developed by Wikimedia CH.
Timeline
editThe project is conceived as a first phase and it starts in November 2016 and it ends in March 2017. We expect the project to continue with new releases and to be further developed in a larger research project related to new ways of evaluating the work of cultural institutions.
Policy, Ethics and Human Subjects Research
editThe research respects Wikimedia policies and it is specifically developed to support partnerships between GLAMs and the Wikimedia projects meant to increase and improve online open knowledge.
Results
editSummery:
We focussed on the visual identity of a statistical tool meant to provide information related to the capacity of GLAMs (galleries, libraries, archives and museums) in contributing to open knowledge and in particular to Wikipedia and the Wikimedia projects.
 Done We developed the front end of a website proving access to the data. Below a report. The documentation is available on GitHub. The website is not yet made available by Wikimedia CH.
- Done We developed a series of visualizations to interpret data and support evaluation and decision making in accordance with the requirements described in the document Requirements Version 2.0 September 12, 2016 - Implementation of the first two statistical features and partial implementation of the third statistical feature (statistic by visitors). The visualizations are based on data made available; if data was not provided we produced visualizations based on a sample.
- Done To research solutions which can enhance GLAMWiki cooperation we provide below a series of ideas to further develop the project. The topic have been submitted for a presentation at Wikimania 2017. Giovanni Profeta is developing his research residency linked to his Ph.D. candidature with a focus on Wikidata knowledge gap and GLAMs. We plan to develop a new research project about knowledge gaps and new system to evaluate GLAMs.
 Doing... Working day for training and testing of the release. The day needs to be set.
Interactive visualisation
editThe project is available on GitHub.
The visualizations are based on a data warehouse produced by the Italian company Synapta for the GLAM statistic tool. The data warehouse provides a copy of content from Wikimedia Commons and Wikipedia; starting from the creation of the data warehouse the visualization can trace changes that happened over time on Wikimedia Commons and Wikipedia.
The category of the institution is at the centre of all the visualizations and reports. This category though can be removed by anyone for different reasons. This is a critical issue of the statistics. To overcome this issue the data warehouse works as a more early accessible backup of the GLAM contribution to the Wikimedia projects.
All visualizations can be downloaded as images in PNG format or as a dataset in JSON format.
Content Network
edit
How images are organized. An overview of how images uploaded by the institutions are organized on Wikimedia Commons.
On Wikimedia Commons images can be organized by category and subcategories. When you upload content you can add categories; categories can be added and changed at any time also manually and semi-automatically. The visualization focuses on a single institution (the institution you selected) and it allows you so see the names of categories about the images, the quantity of images in each category and the category' hierarchy. On the right sidebar you can see the list of categories and you can sort them by name or by size (number of files included in the category); each category provides you a direct link to see its content on Wikimedia Commons. When you click a category on the sidebar, it appears highlighted in the visualization and viceversa.
- How can you use the visualization
The visualization can provide Wikipedians
- an overview of the topics institutions have contributed to
- an idea of how content is organized in categories
- to increase the number and specificity of categories
The visualization can suggest the institution involved
- new images you can upload to increase categories
- new categories they can create
- to increase the number and specificity of categories
- eventually how to reorganize the categories and their hierarchy
- Further developments
In a future release, the visualization can be further developed to change through time by selecting a timeframe. The timeframe will start from the creation of the GLAM statistical tool. It will be possible to provide information about
- how a category changed through time with an increased or decreased number of images
- how categories changed with new ones or a new hierarchy
User Contributions
edit
Who uploaded files. An overview of who uploaded on Wikimedia Commons files of the institution.
The visualization focuses on a single institution (the institution you selected) and it shows you all the accounts who have uploaded images in the category of the institution, when they uploaded them and how many flies they uploaded. They visualization are sorted by the account with the largest number of uploads. On the right sidebar you can see the list of accounts and you can sort them by name or by size (number of files uploaded by the account); each account provides you a direct link to the user page on Wikimedia Commons.
It is important to mention that the Wikimedia projects require people to contribute as individuals; paid collaborators (paid staff of institutions or wikipedians in residence or other collaborators) should disclose their engagement with the institution in their user page.
Files can be uploaded manually or through a bot (a software). It is also useful to know that Wikipedia and the Wikimedia projects are a socio-technological system: people and softwares (bots) interact online and have accounts.
At the moment the visualizations shows the results in the last year.
- How can you use the visualization
The visualization can provide Wikipedians
- a list of collaborators of the institutions
- a list of people involved or interested in the content of the institution
- the user name of people collaborating with institutions (to verify that institutions use individual usernames).
- bot related to the institutions
The visualization can provide the institution involved an overview of
- the work of collaborators
- the flow of uploades
- the engagement of new users
- an overview of delations (in a future release)
- Further developments
In a future release, you will be able to select a timeframe going back from the creation of the GLAM statistical tool. It will be possible to see and monitor who delated content (very often related to copyright infringements or other problematic content). Bot can be differentiated graphically from other accounts.
Page views
edit

How images are organized. An overview of how images uploaded by the institutions are organized on Wikimedia Commons.
Images from Wikimedia Commons can be embedded into Wikipedia articles in different languages. Frequently the images included are photos or copies of original documents. People contributing to Wikipedia can manually add the images to articles. Articles with good images have a better quality but of course there should not be too many images in an article. Images on Wikipedia articles are much more viewed compared to images simply stored on Wikimedia Commons.
In this visualization you see the articles of Wikipedia in all languages including images from the institution. You can see the overall total number of views day by day. On the right sidebar you can select an image included in the Wikipedia articles and see the number of view of that specific image day by day. On the top menu you can select the view from overall view to single image view. On the right sidebar you have also the direct link to see the image on Wikimedia Commons where you find the specific list of pages including it.
- How can you use the visualization
The visualization can provide Wikipedias and the institution involved
- how many people accessed its patrimony
- which are the most viewed images
- Further developments
In a future release, the visualization can differentiate the typology of pages (articles, discussion pages, project pages, user pages) including files owned by the institutions. Other visualizations can be developed to highlight files.
Front end of the statistical tool
editThe website allows access to the GLAM statistic tools. It is meant for three beneficiaries:
- Institutions involved: they can have access to a series of statistics related to their cooperation with the Wikimedia projects. The visualizations are meant to simplify the comprehension of what happened and to support the planning of future steps of the cooperation (i.e. increasing the number of images upload, improving the metadata, adding categories, understanding which content appears more interesting for wikipedias, review the number of views to their content).
- Wikipedians and wikimedians: to monitor the cooperation with GLAMs, to see which content has been uploaded, to eventually ask for new content on different topics.
- Wikimedia chapters and groups: to monitor the cooperation with GLAMs in their countries and to provide metrics about the cooperation.
Content is meant to be accessible to anyone. In case of data aggregated from other sources it might be necessary to create a controlled access for privacy reason.
-
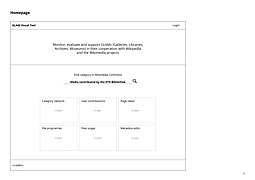 Draft homepage
 -
 Draft of the images hierarchy
 -
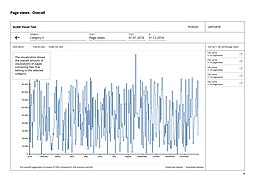 Draft of the pageviews chart (overall)
 -
 Draft of the pageviews chart (single file)
 -
 Draft of the uploads chart


Further developments
edit- Proving the dataset for download in CSV format.
We started identifying a series of visualizations which might be relevant in a second release.
| Image | Description | Possible use |
|---|---|---|

|
Content organized by the size of the files uploaded. | Usability of the images (if they can be printed, published, projected...). |

|
Timeframe of the total uploads | |

|
Correlation between image and its use in Wikipedia pages | |

|
Correlation between the size of an image, the number of times it has been used and the number of categories it has. | |
| Discussion pages and controversies related to content uploaded. |
| |
| Edits on files: changes on categories, description, added descriptions in other languages, licenses and other metadata. | To monitor changes and to acknowledge improvements of content. | |
| List of images and where they are used on the Wikimedia projects. |
| |
| An overview of data based on three characteristic: size, license, format. You can see the number of files with that characteristic on top and on the bottom you see the number of pages in which these files have been included. |
| |
| The correlation between size, format and use of images. |
| |

|
What is the license of content uploaded. Public domain or cc by-sa? |
|

A system of scoring can be introduced to highlight best practices
i.e. percentage of the archive uploaded, number of categories, size and format of the files, metadata included...
References
edit