Learning and Evaluation/Evaluation reports/2013/Other photo initiatives
This is the Program Evaluation page for photo upload initiatives other than Wiki Loves Monuments. It contains information about national photo upload initiatives that are not as big as Wiki Loves Monuments and that aren't necessarily based on a competitive model. Most of these programmatic activities aim at improving the image coverage of a specific subject (e.g. "local nature", "local architecture", or "local music festivals") on Wikimedia Commons.
This report currently contains information based on data collected in late 2013 and will be updated annually. For additional information about this first round of evaluation reports, please see the overview page.
This page reports data for six program leaders photo upload events, including five that were mined and one directly reported.
Key lessons include:
- Program leaders of both Wiki Loves Monuments and other photo upload initiatives reported many priority goals, the two most popular being: (1) focusing on bringing awareness to more people about Wikimedia projects and (2) having fun.
- Budgets were reported for only half of the reviewed photo upload events and ranged from $1,300 USD to just over $20,000 USD.
- The average photo upload initiative lasts 30 days and has 16 participants.
- A total of 50,386 images were uploaded to Commons for the six reported events, and 3,456 (6.9%) images uploaded during these events were already included in Wikimedia project pages.
- The average photo upload initiative generates more than 2,000 image uploads to Commons with associated direct costs just over $0.60 USD per image.
- As with Wiki Loves Monuments, existing editor retention is higher than new user retention following these events. Six months after the events, 73.6% of existing user participants were actively editing on Wikimedia Commons and 64.2% were actively uploading files, but 0% of new users were retained as active contributors to Wikimedia Commons.
Planning a Wiki Loves Monuments or other photo upload event? Check out some process, tracking, and reporting tools in our portal and find some helpful tips and links on this resource page
Program basics and history
edit
Photo upload initiatives focus on improving the quality and amount of photographs about specific subjects. Photo upload initiatives can last from a single day to an entire year. Most initiatives start with online organization and planning, and then move offline quickly, with participants going out in the world to document specific subjects and uploading their images to Wikimedia Commons. The subject matter the participants photograph usually lacks coverage on Wikipedia and Commons. Subjects can vary, ranging from historic places to protected areas, plants, animals, art inside of museums, or music festivals. Some of these initiatives are organized as contests, where participants are eligible to win prizes. Others simply aim at documenting important things in the world while having fun with other Wikimedians and exploring the environment, such as WikiExpeditions, where participants might go camping or stay in hotels while visiting new places and sites for a weekend. After the images are uploaded to Commons, and volunteers often categorize and distribute the images accordingly through Wikimedia projects.
The first documented photo upload initiative was Wikipedia Takes Manhattan, which took place on April 4, 2008, in New York. The event was coordinated by Wikimedia New York City, Columbia University, and New York University. The event focused around a scavenger hunt, in which participants would photograph subjects which the coordinating Wikipedia articles about those subjects were lacking images of the to-be photographed subject. Images were uploaded to Wikimedia Commons and used to illustrated Wikipedia articles. From 2008 on, a number of volunteers is other countries picked up the concept of organizing photo upload events that cover specific topics, in most cases within a local context.
Data report
editResponse rates and data quality/limitations
editWe received only one direct report through our pilot survey, from one program leader. It was a WikiExpedition. In order to expand our evaluation, we mined additional data from five initiatives. This included three Wiki Loves Public Art, one Wiki Takes, and the Festivalsommer pilot project. We collected publicly available data from wiki's and blogs to gather our data. We were able to collect data about: participant count, photos uploaded, photos used in projects, and photo quality (Featured pictures, Quality images, Valued images). We were able to collect budget data for three events and hour inputs for two events. You can read more about our supplemental data mining here. We were unable to provide reporting about replication and shared learning due to low reporting.
As with all the program report data reviewed in this report, report data were often partial and incomplete, please refer to the notes, if any, in the bottom left corner of each graph below.
Report on the submitted and mined data
editPriority goals
edit- Program leaders for both Wiki Loves Monuments and other photo upload initiatives reported twelve priority goals, with the two most popular focusing on bringing awareness to more people about Wikimedia projects and having fun.
We asked program leaders to select their priority goals for Wiki Loves Monuments and other photo upload initiatives. We provided 18 priority goals with an additional 19th option to report on "other" goals. They could select as many or as few as they saw fit. Five of the program leaders (100%) who reported on both WLM and other photo initiatives selected priority goals, since there were so few direct reports and photo upload events have overlapping priority goals we analyzed all responses together. Those five selected between four and 14 priority goals for each of their events.[1] While many goals were selected by the majority of the reporting program leaders, two goals stood out as priority across implementers. The top two goals, selected by four of the five program leaders, were to (1) Increasing awareness of Wikimedia and its projects and (2) Making contributing fun (see table below):

Inputs
edit- In order to learn more about the inputs that went into planning workshops, we asked program leaders to report on
- The budget that went into planning and implementing the workshop
- The hours that went into planning and implementing the workshop
Budget
edit- Reported budgets were available for half of reported photo initiatives and ranged from $1,300 USD to just over $20,000 USD.
We collected budget data for 3 photo initiatives (50%). Budgets ranged from $1,300 USD for a 10-day event, to $20,266.50 USD for an event that lasted for several months. [2]
Hours
edit- We received staff hour data for only one photo upload initiative, and volunteer hours for only one initiative.
We received very little data about hour inputs. We collected data about staff input hours for one event, and volunteer input hours for another:
- Staff hours: 80 hours went into implementing an event that lasted several months.
- Volunteer hours: 20 hours went into implementing an event that lasted 10 days.
Without additional reporting, we're unable to determine the average time that goes into planning these events.
Outputs
edit- We also asked about two outputs in this section
- How many hours did the event last?
- How many people participated in the event?
Event length
edit- The average photo initiative lasts 30 days.
Photo upload initiatives last from a single day, to several months. The average[3] event lasts 30 days[4] (see Graph 1).

Participation
edit- The average photo upload initiative has 16 participants.
All six (100%) photo upload initiatives had participant counts. These counts ranged from four to 365. Events averaged 16 participants, the same as edit-a-thons.[5]
Out of the six photo upload events reviewed for this report, participant usernames were available for five events.
Outcomes
edit- A total of 50,386 images were uploaded to Commons for the six reported events, and 3,456 (7%) images uploaded during these events have already been included in Wikimedia project pages.
- The average photo upload initiative uploads just over 2,000 images to Commons. The average amount of images placed in Wikimedia projects was 885. Events that had fewer than 5,000 image uploads had a higher image rate, but we need more data to evaluate that.
We collected photo upload counts for all six photo upload initiatives. A total of 50,386 photos were uploaded to Wikimedia Commons from these events. Upload counts ranged from 87 to 33,086. The average event uploaded 2,206 photos.[7] Regarding unique image use in Wikimedia projects, a total of 3,456 (7%) unique images are used in Wikimedia projects from these events.Unique image use ranged from 21 to 1824. The average number of unique images used from a photo upload initiative is 318 images[8] (see Graph 2).
- A very small percentage of images from photo upload initiatives are awarded quality status on Wikimedia Commons.
Out of 50,386 photos uploaded for the reported photo upload initiatives, 156 were rated as Quality, Valued, and/or Featured Image (see Graph 2). Out of those 156:
- 152 were rated as Quality Images
- 1 was rated as Valued Images
- 3 were rated as Featured pictures
Some photos are included in multiple categories.

- The average photo upload initiative spends just over $0.60 cents USD for each photo uploaded.
Three implementations (50%) reported budget data, and we were able to determine the cost of each image based on those budgets. The cost ranged from $0.06 USD to $1.70 USD. The average was $0.64 USD (see Graph 3).
-
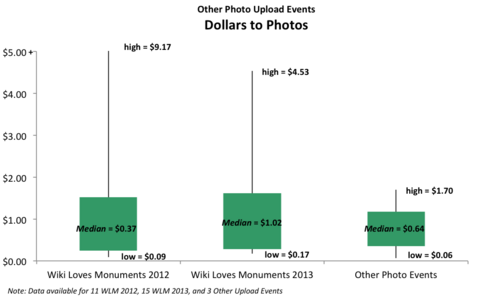 Graph 3: Dollars to photos/media added. As illustrated in the box plot, photo upload events demonstrated a rather narrow range of variation in the input dollars to the amount of content added; from as little as $0.06 US per photo/media added to $1.70 US per photo/media added. The median reported input budget for the three events reported was $0.64 US per photo.

- The number of photos uploaded ranged from 87 to 33,087; more research needs to be done in order to determine how the number of participants affects the rate of uploaded photos.
-
 Graph 4: Participants to photos. As illustrated in the graph, the number of photos uploaded ranged from 87 to 33,086 uploaded by 4 to 365 contributors, of which, 6% to 24% photos had been used (as of November 4, 2013). In the graph, the number of participants is illustrated by bubble size and label. It appears that, the number of participants did not necessarily relate to the use rate of uploaded photos, but that the use rate was higher for events in which the number of uploads did not exceed 5,000 photos. More data are needed to confirm and/or further explore this observation.

Recruitment and Retention of Active Users
editAs of reporting time, we were able to evaluate recruitment and retention of active users for five of the photo upload events for which we had usernames. A few things to remember with this section:
- An active retained user is considered one that makes 5 or more edits a month. We examined both the "pages created" (a new page gets created when someone uploads a file) and "edit count" using Wikimetrics to measure user activity on Wikimedia Commons[9].
- A "survived" editor is defined as one that made at least one edit in a given window of time after the event ended.
- User retention was measured for both survival and active user retention. Retention was assessed for the first three months after the event (Quarter 1) and the second set of three months (Quarter 2: months four, five, and six) following the event. Here we considered users as surviving if they had made a single contribution, and "active" if they had averaged [10]5 or more edits a month, during the follow-up window.
New users
edit- Six months after the end of these photo upload events, 0% of new users were retained as active contributors to Wikimedia Commons.
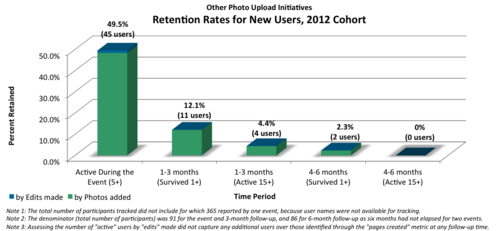
91 new users participated in the five events for which usernames were available for tracking. 44 (48.3%) of these uploaded five or more files and 45 (49.5%) made five or more edits during their upload event time. With regard to retention (see Graph 5):
- Three-month follow-up (First quarter)
- Survival (Any contributions)
- 11 (12.1%) of new users had made at least one edit and uploaded at least one new file to Wikimedia Commons.
- Active (Average 5+ contributions a month)
- 4 (4.4%) of new users had made 15+ edits and uploaded at least 15 files during the first quarter of retention follow-up.
- Six-month follow-up (Second quarter)
- Survival (Any contributions)
- 2 (2.3%) of the 86 new users eligible for 6 month follow-up had made at least one edit and uploaded at least one new file to Wikimedia Commons.
- Active (Average 5+ contributions a month)
- 0 (0.0%) of the 86 new users eligible for 6 month follow-up had made 15+ edits and uploaded at least 15 files during the first quarter of retention follow-up.
- Survival (Any contributions)
-
 Graph 5: New user retention.
This bar graph shows the number users who actively contributed to the event and the number of new users retained for periods of three months at three and six months following the events. A total of 91 new users participated in the five events for which usernames were available.

Existing users
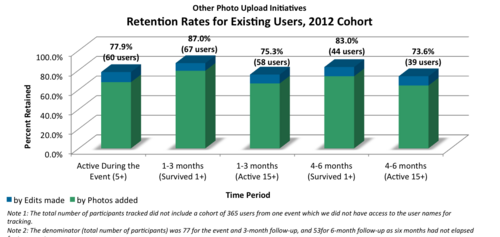
edit- As with Wiki Loves Monuments, existing editor retention is higher than new user retention for photo upload events, and participants demonstrate a higher rate of “active” participation following these events as compared to Wiki Loves Monuments. Six months after the events, 73.6% of existing user participants were actively editing on Wikimedia Commons and 64.2% were actively uploading files.
77 existing users participated in the five events for which usernames were available. 52 (67.5%) of these uploaded five or more files and 60 (77.9%) made five or more edits during the events. With regard to retention (see Graph 6):
- Three-month follow-up (First quarter)
- Survival (Any contributions)
- 67 (87.0%) of existing users had made at least one edit and 61 (79.2%) had uploaded at least one new file to Wikimedia Commons.
- Active (Average 5+ contributions a month)
- 58 (75.3%) of existing users had succeeded at making 15+ edits during the first quarter of retention follow-up.
- 51 (66.2%) of existing users had uploaded 15+ files during the first quarter of retention follow-up.
- Six-month follow-up (Second quarter)
- Survival (Any contributions)
- 44 (83%) of the 53 existing users eligible for 6 month follow-up had made at least one edit and 39 (73.6%) had uploaded at least one new file to Wikimedia Commons.
- Active (Average 5+ contributions a month)
- 39 (73.6%) of the 53 existing users eligible for 6 month follow-up had succeeded at making 15+ edits during the second quarter of retention follow-up.
- 34 (64.2%) of the 53 existing users eligible for 6 month follow-up had uploaded an average of 15+ files during the second quarter of retention follow-up.
- Survival (Any contributions)
-
 Graph 6: Existing user retention, 2012
This bar graph shows the number users who actively contributed to the event and the number of new users retained for periods of three months at three and six months following the events. A total of 77 existing users participated in the five events for which usernames were available.

Summary, suggestions, and open questions
editHow do the programmatic activities deliver against their own goals?
editIn what program leaders reported back, two goals stood out as priority across implementers: increasing the awareness of Wikimedia projects and making contributing fun. With regard to both goals, our lack of qualitative data significantly limits our ability to state whether those goals might have been met or not. All we can say at this point is:
- We currently don't know whether and to what extent photo upload initiatives increase the awareness of Wikimedia projects. However, the average number of 16 participants per implementation suggests that the reach of this kind of programmatic activities – just looking at the number of participants – is limited. In cases, where the organizers were able to get some press coverage around their events, this might be different. In those cases it would be of interest to know how many people could be reached through journal or newspaper articles and to which extend the press coverage changed people's awareness of Wikimedia projects.
- Although we don't have qualitative data about how much fun it was for the participants to take part in this kind of event, the fact that people in different countries repeatedly organize local events of this kind indicates that volunteers enjoy taking part in these programmatic activities. Also, the total amount of photos being uploaded as a result of the event might help with understanding how much of their volunteer time people were willing to invest, which would also be an indicator of how much they enjoyed this kind of activity.
Other than that, photo upload initiatives like WikiExpeditions, Wiki takes…, Head Eesti Looduse Pildid, Festivalsommer, and others clearly show impact on Wikimedia projects. People who participated in these activities uploaded impressive amounts of images to Wikimedia Commons. They also – and it's important to highlight at this point that quantity of uploads should not be the sole measure of success – filled important gaps on Wikipedia. Images taken of local architecture, local nature, or local music festivals illustrate articles across language versions that would otherwise lack images.
With that being said, more in-depth analysis needs to be done in the future in order to find out how this kind of programmatic activity delivers against its other goals.
How do the costs of the programmatic activities compare to their outcomes?
editWhen it comes to comparing the costs of photo upload initiatives to their outcomes, a few things stick out:
- Half of the implementations report a zero budget. It seems like this kind of event can be executed by volunteers without them getting any financial support (e.g. through the Foundation or a local chapter).
- Photo upload initiatives that receive funding demonstrate a lower rate of variation in costs than Wiki Loves Monuments implementations that receive funding. At the same time, photo upload initiatives show a high rate of variation with regard to how many images are getting uploaded to Wikimedia Commons. In-depth analysis will be needed in order to get a better picture of how funding and outcomes are related.

Other than that, the evaluation team had the opportunity to work closely with one of the implementers on a more thorough analysis of how the costs compare to a hypothetical scenario where professional photographers would have been hired to achieve the same results. Between August and November, we conducted a number of phone interviews with Achim Raschka, the program lead for the photo upload initiative Festivalsommer (English festival summer) who provided us with additional information about the initiative that he created on the German Wikipedia.
Achim started Festivalsommer in 2013. It is designed to be a year-long event that engages volunteer photographers in adding images of bands, individual artists, and orchestras to Wikimedia Commons and therefore fills gaps across language versions when it comes to illustrating music articles. As part of the process, German Wikimedians get accredited as official photographers and travel to music festivals to take photos. Afterward, they upload those photos to Wikimedia Commons and use the images to illustrate the corresponding articles on the German Wikipedia.
The organizers of Festivalsommer 2013 received a project grant of 18,000 € (the majority of which was for camera equipment) from Wikimedia Germany that they hadn't fully spent on November 4, 2013, the reporting deadline for this evaluation report. Achim estimated that Wikimedia Germany put in additional 80 hours of staff time to help him with getting things off the ground.
By November 4 – and therefore about two months before Festivalsommer 2013 concluded – participants had already uploaded more than 11,900 photos to Wikimedia Commons (2013 end of year: 13,088). Volunteer photographers had covered a total of 46 music festivals (2013 end of year: 69[11]).
Now, how does the investment of 18,000 € plus the additional 80 staff hours compare to a hypothetical scenario where professional photographers would have been sent to those 69 festivals?
In Germany, the Mittelstandsgemeinschaft Foto-Marketing, an association of professional photographers provides its members with advice on what to charge for a photo assignment. In 2012[12] their advice was to charge the following amounts:
- 1/2 day (up to 4 hours): from 275 / 385 / 825 €,
- 1 day (up to 8 hours): from 385 / 550 / 1,100 €,
- 1 day (more than 8 hours): from 495 / 660 / 1,375 €
Assumed that travel to and from the venue, shooting, image selection, post-processing, uploading, etc., took the volunteer photographers only 4 hours per festival, hiring professional photographers for the same time and total number of festivals (69) would have cost 26,565 € if we assume a mid-range price. In case the volunteer photographers invested up to 8 hours (which seems to more realistic), hiring professional photographers would have cost 37,950 €.
Now, even if the volunteers got no fun out of the event and the awareness of Wikimedia projects didn't increase, this example shows that from a cost-benefit perspective, Festivalsommer 2013 was still substantially cheaper than if someone hired professional photographers to document the same number of music festivals.
Of course, this raises a question of image quality, but we return to how the money for this program was spent: largely toward purchasing professional camera equipment. From what we have seen, volunteers with professional photography equipment, official photographer accreditation (and thus better access to the stage), and some photography knowledge take photos of almost similar quality to professional photographers.
Even better, this model scales quickly and cost effectively. Purchasing professional photography equipment is expensive, but once the equipment has been purchased, repeating the program the next year becomes much cheaper. Since Festivalsommer is being repeated in 2014, we anticipate the image contribution quantity and quality will be similar, while the cost will be significantly less since the program is re-using the equipment purchased in 2013.
How easily can the programmatic activities be replicated?
editAt this point, we are not aware of documentation that would enable people to replicate this kind of programmatic activity. However, this doesn't mean that documentation doesn't exist. It might just mean that we haven't done enough research or that information isn't available in English.
Next steps
edit- Next steps in brief
- Increased tracking of detailed budgets and donated resource inputs by program leaders.
- Improved ability for program leaders to collect and track staff and volunteer input hours.
- Valuation of volunteer hours input and estimation of comparative costs.
- Use of better tracking systems for participant cohorts to examine recruitment and retention associated with specific contests.
- Increased ability to collect experiential survey data to events and participant activity.
- Next steps in detail
As with all of the programs reviewed in this report, a higher rate of reporting is needed along with efforts toward properly tracking and valuing programming inputs in terms of budgets, donated resources, and hours invested in activities related to planning and implementing the events. Valuation of both inputs and outputs, in terms of monetization of volunteer time and comparative cost estimates, will be important steps toward better cost-benefits analysis. In addition it will be important to better track particular participant cohorts for examination of recruitment and retention. Lastly, further investigation of expectations and efforts directed toward the many other goal priorities is needed, including for the top two goals of increasing awareness of Wikimedia projects and making contributing fun. It will be important to more clearly articulate programming activities specifically aligned to those goals and to develop strategies for program leaders to measure those potential outcomes.
Appendix
editSummative Data Table:Other Photo Upload Initiatives
edit| Percent Reporting | Low | High | Mean | Median | Mode | SD | |
|---|---|---|---|---|---|---|---|
| Non-Zero Budgets | 50% | $1,300.00 | $20,266.50 | $7,854.00 | $1,995.50 | none | $10,755.16 |
| Staff Hours | 17% | 80.00 | 80.00 | Report count of 1 | 0.00 | 0.00 | 0.00 |
| Volunteer Hours | 17% | 20.00 | 20.00 | Report count of 1 | 0.00 | 0.00 | 0.00 |
| Total Hours | 33% | 20.00 | 80.00 | 50.00 | 50.00 | none | 42.43 |
| Donated Meeting Space | 0% | Not Applicable - Frequency of selection only | |||||
| Donated Materials/ Equipment | 17% | ||||||
| Donated Food | 0% | ||||||
| Donated Prizes/Give-aways | 0% | ||||||
| Participants | 83% | 7 | 365 | 89 | 16 | 16 | 141 |
| Dollars to Participants | 50% | $5.39 | $633.32 | $321.24 | $325.00 | none | $313.98 |
| Input Hours to Participants | 33% | 2.50 | 5.00 | 3.75 | 3.75 | none | 1.77 |
| Bytes Added | Not Applicable (Photo counts instead) | ||||||
| Dollars to Text Pages (by Byte count) | |||||||
| Input Hours to Text Pages (by Byte count) | |||||||
| Photos Added | 100% | 87.00 | 33086.00 | 8398.00 | 2206.00 | none | 12841.00 |
| Dollars to Photos | 50% | $0.06 | $1.70 | $0.80 | $0.64 | none | $0.83 |
| Input Hours to Photos | 33% | 0.01 | 0.01 | 0.01 | 0.01 | none | 0.00 |
| Pages Created or Improved | Not Applicable (Photo counts instead) | ||||||
| Dollars to Pages Created/Improved | |||||||
| Input Hours to Pages Created/Improved | |||||||
| UNIQUE Photos Used | 100% | 21.00 | 1824.00 | 576.00 | 318.00 | none | 675.00 |
| Dollars to Photos USED (Non-duplicated count) | 50% | $1.09 | $24.78 | $11.28 | $7.98 | none | $12.19 |
| Input Hours to Photos USED (non-duplicated count) | 33% | 0.10 | 0.12 | 0.11 | 0.11 | none | 0.02 |
| Good Article Count | Not applicable | ||||||
| Featured Article Count | |||||||
| Quality Image Count | 100% | 1 | 125 | 25 | 5 | 5 | 49 |
| Valued Image Count | 100% | Only one event generated a image rated as valued | |||||
| Featured Picture Count | 100% | One event generated 1 featured picture and another generated 2 | |||||
| 3 Month Retention | 83% | 19% | 86% | 60% | 81% | none | 33% |
| 6 Month Retention | 50% | 19% | 57% | 33% | 23% | none | 21% |
| Percent Experienced Program Leader | 33% | Not Applicable - Frequency of selection only | |||||
| Percent Developed Brochures and Printed Materials | 0% | ||||||
| Percent Blogs or Online Sharing | 33% | ||||||
| Percent with Program Guide or Instructions | 0% | ||||||
Bubble Graph Data
editData for Graph x. Participants to Photos.
| Report ID | Photos added | Number of Participants | Unique Images Used (as of Nov 4, 2013) |
|---|---|---|---|
| 128 | 11928 | 13 | 818 |
| 94 | 33086 | 365 | 1824 |
| 125 | 2410 | 116 | 472 |
| 126 | 87 | 16 | 21 |
| 127 | 873 | 7 | 158 |
| 38 | 2002 | 16 | 163 |
More Data
editProgram Inputs
| Report ID | Program Length (in weeks) | Budget | Staff Hours | Volunteer Hours | Total Hours |
|---|---|---|---|---|---|
| 128 | 38.7 | $20,266.50 | 80 | 80 | |
| 94 | 5.86 | $1,995.50 | |||
| 125 | 4.43 | ||||
| 126 | 4.43 | ||||
| 127 | 0.14 | ||||
| 38 | 1.57 | $1,300.00 | 20.00 | 20 |
Program Outputs
| Report ID | Number of Participants | Number NEW User Account Created | Number Photos/media Added |
|---|---|---|---|
| 128 | 13 | 2 | 11928 |
| 94 | 365 | 33086 | |
| 125 | 116 | 76 | 2410 |
| 126 | 16 | 10 | 87 |
| 127 | 7 | 0 | 873 |
| 38 | 16 | 3 | 2002 |
Program OutcomesːQuality Improvement and Active Editor Recruitment and Retention
| Report ID | Number UNIQUE Photos Used | Number Quality Images | Number Valued Images | Number Featured Pictures | 3 month Active Editor rate | 6 month Active Editor rate |
|---|---|---|---|---|---|---|
| 128 | 818 | 125 | 1 | 1 | 85% | |
| 94 | 1824 | 5 | 0 | 0 | Unable to pull data using current tools we have. | |
| 125 | 472 | 11 | 0 | 0 | 19% | 23% |
| 126 | 21 | 1 | 0 | 0 | 31% | 19% |
| 127 | 158 | 5 | 0 | 0 | 86% | 57% |
| 38 | 163 | 5 | 0 | 0 | 81% | Not reached 6 months yet. |
Notes
edit- ↑ (Mean= 9, SD= 4)
- ↑ There is a median budget of $1,995.50, and that is associated with one event that lasted one month. The mean = $7,854 and standard deviation was $10,755.
- ↑ Averages reported refer to the median response.
- ↑ Mean= 9 weeks, Standard deviation= 15 weeks
- ↑ Mean= 89, Standard deviation= 142
- ↑ Note: Although "content production" is a direct product of the program event itself and technically a program output rather than outcome, most of the program leaders who participated in the logic modeling session felt this direct product was the target outcome for their programming. To honor this community perspective, we include it as an outcome along with quality improvement and retention of "active " editors.
- ↑ Mean=8398, SD=12841
- ↑ Image use appeared higher for those events for which more than a month or two had passed. Specifically, looking at the three events which had reached more than a one or two month follow-up point, the use rate of uploaded images was 19%.
- ↑ Pages created and edits were assessed for namespace 6 for files on Commons.
- ↑ by counting those who had made 15 or more edits for the three month quarter. However, users could make 15 or more edits during any period of time, not five or more each month necessarily. This solution allows us to even much of the month-to-month variation of users to get at those users who are more or less staying active on the project. For example, someone who made five edits in the first month, three edits in the second month, and six edits in the third month following the event would be counted as active for the full three-month quarter. At the same time, someone who made all their contributions in the first month following the contest, and nothing further, would also be counted as surviving or active for the quarter.
- ↑ As per Wikipedia:Festivalsommer/Evaluierung.
- ↑ MFM-Empfehlung 2012