Community Insights/Community Insights 2020 Report/Collaboration, Diversity & Inclusion (2020)
The experienced social environment: Diversity, Inclusion, & Collaboration
editWikimedians do not contribute to the movement in a vacuum--an environment which enables collaborative relationships helps individuals achieve shared goals.[1] Drawing from existing research on collaborative environments in the education[2] [3] and business sectors. [1][4][5], the Global Data & Insights team has identified eight indicators of a collaborative and engaged environment, as well as five indicators of an inclusive environment, in the Wikimedia context.[4][6][7] Understanding how different Wikimedians experience different aspects of collaboration and inclusion can help identify critical levers for improving on-wiki experiences and movement success (See Appendix:Methodology).
Key findings
edit- Across the nine Collaborative Engagement factors, the strongest were Engagement itself, Collaborative Intention, Feelings of Belonging, and for many, Fairness; the lowest were perceptions of Self-Awareness and Movement Strategy.
- Across all five diversity and inclusion factors, the strongest factor was Non-Discrimination, indicating infrequent experience of discrimination; the lowest factors were Leadership Commitment to Diversity and Inclusive Culture.
- Overall Diversity & Inclusion factors were stronger than Collaborative Engagement factors, especially Non-Discrimination and Individual Commitment to Diversity.
- Many Collaborative Engagement and Diversity & Inclusion factors are strongest for those who take on administrative and organizing responsibilities and tend to be lowest for Developers, and to some extent, Editors and on-wiki admins.
- Developers scored significantly lower than Movement Organizers in terms of Engagement, Feelings of Belonging, Fairness, Movement Leadership, and Movement Strategy
- Editors and On-wiki admins scored significantly lower than Movement Organizers in terms of Individual Commitment to Diversity, Inclusive Culture, and Inclusive Interactions.
- Developers and Movement Organizers were more likely to report experiencing discrimination than Editors.
- There is a year-over-year trend of declining perceptions of Fairness, Feelings of Belonging, Movement Leadership, Non-Discrimination, and Inclusive Culture; while there is an opposite trend for Inclusive Interactions.
- Collaborative Engagement factors were experienced more strongly by males with the exception of self-awareness and confidence in Movement Strategy. Non-males were much more likely to experience discrimination and less likely to experience an inclusive culture or individual commitment to diversity than males.
- We were more likely to hear from non-English fluent contributors from the continents of Africa and North America than other continental regions.
- Collaborative Engagement factors were experienced more strongly by those with English fluency, whether Native or otherwise. Interestingly, inclusion factors were experienced more strongly by those with additional language fluency in a non-English language, however, they were also more likely to experience discrimination.
- There were additional differences related to age and education which were less frequent and inconsistent across the factors. Contributors in Africa, Asia & Pacific, and South America were twice as likely to be under the age of 35 than in North America and Europe. Contributors in Asia & Pacific had significantly fewer years of formal schooling than all other regions and were half as likely as contributors from South America to have more than 18 years. Contributors with less formal education were also more significant among audiences from South America as well as Asia & Pacific.
- Collaborative Engagement factors were strongest among respondents from Africa, and in some cases, to a lesser extent, for those in Europe or North America. The largest difference was observed in relation to experiences of Engagement, Fairness, Awareness of Others and Movement Strategy. There was also a significant difference predicted by geography in terms of perceptions of Movement Leadership. In most cases, ratings by participants in Africa stood out as significantly higher while ratings by participants in North America tended to be lower across all factors.
- Individual Commitment to Diversity was highest among editors in Africa and lowest in Asia & Pacific, Europe, or South America. Those in South America, Asia & Pacific were also less likely to experience discrimination while those in Europe experienced it most often
About the data
edit
Data were collected within the Community Insights survey process September-October 2019. Participants were sampled from across Wikimedia community spaces and data weighted according to the Community Insights survey sampling and weighting strategy (See also Methodological Appendix A, Community Insights Report 2019). Wikipedia was the most cited community space for reflection when answering the questions about community climates. The second most reflected upon space was other online project spaces for all audiences of editors (See Appendix: Methodology).
The Gender Gap across contributors groups
editBefore diving in, it is also important to recognize there is a much larger gender gap for Editing and On-wiki Admin audiences than for Movement Organizers or even Developers. Organizing Admins are 24% less likely to be non-male than contributors overall; while Developers are 72% more likely to be non-male and Movement Organizers are 112% more likely to be non-male than contributors overall. These audience differences make some of the findings for On-wiki Admins especially interesting in some cases. 1
Geo differences across contributors groups
edit
A second significant difference in our audience distribution should also be noted. We heard from disproportionately more organizers than editors in both Africa and Asia & Pacific, as well as from more Editors than average in South America, and to a lesser extent, Europe. 2
Factors of Collaborative Engagement
editOur 2019 set of Collaborative Engagement constructs include:
Awareness of Self and Others (5 questions)
To what extent are people aware of others and their own motivations?
Collaborative Intention (4)
How much do contributors feel that others are interested in building successful cooperative relationships?
Engagement (5)
How much do community members identify with, are inspired by, and promote being a part of the Wikimedia movement and its projects?
Fairness (1)
To what extent do community members experience their contributions being challenged and/or removed unfairly or inappropriately?
Feelings of Belonging (2)
How respected do people feel as a part of the Wikimedia movement, its organizations, and decision-making processes?
Movement Leadership (4)
How confident are community members in the Foundation's ability to support the global movement and for the Foundation and other organizations to communicate well about their projects and initiatives?
Movement Strategy (4)
New for 2020 reporting: How confident are communities in the movement strategy process.
Problem Solving & Negotiating (2)
How much do community members feel that others seek fair solutions and are willing to talk through competing personal interests?

Overall the strongest factors of Collaborative Engagement were Engagement itself, Collaborative Intention, Feelings of Belonging, and for many, Fairness; the lowest were perceptions of Self-Awareness and Movement strategy. Contributors were more than four times as likely to rate Engagement favorably than Self-Awareness while the other factors mentioned were three times more likely to receive favorable ratings.
There were some differences between audiences, for certain factors, engagement as a project admin and/or movement organizer related to significantly higher scores. Collaborative Engagement factors are strongest for those who take on administrative and organizing responsibilities and tend to be lowest for Developers, and to some extent, editors. (Note: Superscript notations clarify significant differences: ‘ p < 0.10; * p < 0.05; ** p < 0.01; *** p < 0.001). Those factors which were significantly different following this pattern of the highest scores occurring among organizers and lowest among developers and editors included: Engagement, Feelings of Belonging, Fairness, Movement Leadership, and Movement Strategy. In the case of the latter three factors, Movement Organizing on-wiki Admins also scored significantly differently from movement organizers more generally. 3 Editors were, on average, 7% more likely, On-wiki Admins 16% more likely, Movement Organizers were 18% more likely, and Organizing admins were 24% more likely to share a favorable rating than Developers across the Collaborative Engagement factors.
-
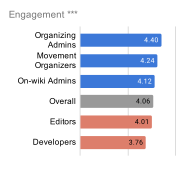 Figure 3. On-wiki Admins and organizers were 21-32% more likely than Developers to share a favorable rating.
 -
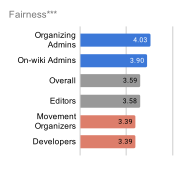 Figure 4. On-wiki Admins and organizing Admins were 59-61% more likely than Developers to share a favorable rating while Editors were 32% more likely to do so.
 -
 Figure 5. Organizers were 37-46% more likely than Developers to share a favorable rating, while Editors and On-wiki Admins were 17 and 27% more likely to do so, respectively.
 -
 Figure 6. Editors and Movement Organizers were 9-11% more likely than Developers to share a favorable rating, while On-wiki Admins 2% less likely to do so.
 -
 Figure 7. Organizers were 51-61% more likely than Developers to share a favorable rating, while Editors were 29% less likely to do so.


While much of the potential for year-over-year comparison has been interrupted this year due to changes to improve the underlying survey items, some small but significant differences were seen in decreases to the average score as outlined in the table below. This was especially true for Fairness and Feelings of Belonging which declined up to 4% and Movement Leadership which declined up to 6% compared last year.4
These declines reflect a small, but significant, reduction in perceptions: that edits are challenged or reverted fairly, of feeling respected in the Wikimedia movement, that there is open and honest communication between different organizations and groups in the Wikimedia movement, that the Wikimedia Foundation and other movement organizations communicate well about their projects and initiatives, as well as a reduced satisfaction with the Wikimedia movement's decision-making processes. All year over year comparisons are available in the Appendix along with noted on the changes to items (See Appendix: Changes from 2018 to 2019).
| Collaborative Engagement:
Changes from 2018 to 2019 |
Change
2018-2019 |
|---|---|
| Fairness** | 🔻 |
| Feelings of Belonging*** | 🔻 |
| Movement Leadership*** | 🔻 |
Factors of Diversity & Inclusion
editThe 2019 survey constructs include:
Non-Discrimination (2)
To what extent do community members experience unsafe environments or unfair treatment due to their identity?
Inclusive Culture (3)
Do community members feel that Wikimedia communities are making progress with diversity initiatives?
Inclusive Interactions (4)
Do community members experience an environment that supports the free and open expression of ideas among contributors of different backgrounds?
Individual Commitment to Diversity (5)
How much do community members value working with contributors of different backgrounds?
Leadership Commitment to Diversity (4)
Do community members think that movement leaders encourage and support diverse participation and content creation?

Across all five diversity and inclusion factors, the strongest factor was Non-Discrimination, indicating infrequent experience of discrimination; the lowest was tied between Leadership Commitment to Diversity and Inclusive Culture. Non-Discrimination was 40% more likely to receive favorable ratings than Leadership Commitment to Diversity.
Again, there were some differences between audiences. Diversity & Inclusion factors are also strongest for those who take on administrative and organizing responsibilities and tend to be lowest for Developers (Note: Superscript notations clarify significant differences: p < 0.10; * p < 0.05; ** p < 0.01; *** p < 0.001). On the factor of Individual Commitment to Diversity, Editors and On-wiki admins scored significantly lower than Movement Organizers; Similarly, engagement as a movement organizer related to higher scores for Inclusive Culture and Inclusive Interactions, compared to engagement as Editor, Developer, or even non-organizing Admin. However, the Non-Discrimination factor illustrated an opposite pattern, in terms of discrimination, Developers and Movement Organizers were more likely to report experiencing discrimination than Editors.5 On average, across the Diversity & Inclusion factors, Editors and non-organizing On-wiki Admins were 4-5% more likely to share favorable ratings than Developers while organizers were 9-11% more likely to do so.
-
 Figure 9. On-wiki Admins and Editors were 21 and 24% more likely than Developers to report favorable ratings while Organizers were 9-11% more likely than Developers to do so.
 -
 Figure 10. On-wiki Admins and Editors were 8 and 1% more likely than Developers to report favorable ratings while Organizers were 14-19% more likely than Developers to do so.
 -
 Figure 11. Editors and On-wiki Admins and were 9 and 11% less likely than Developers to report favorable ratings while Organizers were 7-13% more likely than Developers to do so.


As with the Collaborative Engagement constructs, much of the potential for year-over-year comparison was interrupted by changes to improve the underlying survey items, still, one small but significant decrease and one larger significant increase were seen in the 2019 data as outlined in the table below. This was true for Non-Discrimination and Inclusive Culture, for which scores decreased, and Inclusive Interactions, for which scores increased compared to last year.
This was especially true for Inclusive Culture which declined an average 7%, Non-Discrimination which declined an average 1% and Inclusive Interactions which increased up to 2% compared to last year. The declines reflect small, but significant, decreases in perceptions of appreciation for contributors from different cultural backgrounds, lowered perceptions of progress being made with diversity initiatives and treating different project and contributor groups fairly, as well as increased experiences with unfair treatment related to association with a specific cultural or social group and feeling unsafe or uncomfortable contributing to Wikimedia projects online. The increase in Inclusive Interactions reflects a small, but significant, increase across all inputs compared to last year; Increased perceptions of contributors of different backgrounds interacting well and being valued equally, Reduced perceptions of tolerance for racial, ethnic, and gender-based jokes and increased perceptions of Wikimedia project and community spaces providing an environment for the free and open expression of ideas.6 (See also Appendix: Changes from 2018 to 2019).
| Diversity & Inclusion :
Changes from 2018 to 2019 |
Change
2018-2019 |
|---|---|
| Non-Discrimination*** | 🔻 |
| Inclusive Interactions*** | ▲ |
| Inclusive Culture*** | 🔻 |
Considerations & conclusion
editIn 2018 the Wikimedia movement set out to identify specific strategic recommendations to target the identified shared direction for the Wikimedia Movement: Knowledge as a Service, and Knowledge Equity; to build tools for collaborative partnerships to exchange free knowledge, and to break down social barriers to bring along those who have been left out by structures of power and privilege, respectively. In 2020, these recommendations have been finalized and released for community consideration and planning. There are several movement strategy recommendations for which the current data are relevant, these metrics are mapped along key strategy recommendations which are relevant, along with their summary data on the strength of each factor overall, and year-over-year trends in Appendix: Metrics to movement goals mapping.
There are many ways to use these data. (1) Look to weaknesses (2) Look to the strengths (3) Look for the gaps.
Look to weaknesses to identify areas for intervention.
editWith a problem-orientation, one might use the data to identify weak points and either work to further investigate and understand the weakness, or to change what they think may be causing the weakness.
Look to the strengths to identify reliable community skills and resiliency traits.
editWith a strengths-based approach, one might use the data to identify strong points and either work to further investigate and understand those strengths to try to maintain, or, work to expand those strengths to other spaces.
Look for the gaps between contributor or demographic groups to identify unequal advantages or barriers.
editFocusing on gaps between different audiences and demographic groups one may better identify barriers or potential intervention areas that could change the situation for those audiences being left behind.
Gaps in the weaknesses to identify those who are advantaged.
editSimilar to above, one might look to the weakest factors to identify gaps between audiences and demographics which stand-out as scoring favorably.
OR
Focusing on Feelings of Belonging, one might look to potential interventions through recognition programs or implement process design changes to prevent community practices which create a climate for high-exposure social criticism.
Gaps in the strengths to identify those being left behind.
editAlternatively, one may also look to the strengths and dig in to explore where certain contributing groups seem to fall behind.
OR
Focusing on Individual Commitment to Diversity, recognizing the higher level of exposure to issues of conflict and/or harassment that on-wiki admins and movement organizers experience and considering to bolster the support available to them as community gatekeepers.
Calls to action
edit1. Dive deeper into the supplemental report’s portal
editReview the different report sections and data appendices for data relevant to the audiences you interact with most.
2. Dive deeper into the data using the interactive report
editWe have posted aggregate data tables and interactive charts in google data studio, here you can be in charge of which measures and audiences you view and can view the aggregate data directly in the shared tables
3. Use the report to drive change in your context
editThere are many ways to apply the data to develop interventions and changes to systems, it is our hope that this annual report might help Foundation and Movement stakeholders alike to:
- Understand the demographic intersections of inequity within the world and within our movement and how they do or do not mirror one another so that we can target areas for improvement.
- Examine products, services, and resource supports to identify how to address critical issues of inequity within our world and the movement to become a more inclusive and equitable movement.
- Identify potential actions which could be taken within the scope of current funding, programs, and policy initiatives to improve our community environments.
- Budget for improvements to products, services, and resource supports to address critical issues of inequity within the movement by breaking down the systemic inequities that have been built into support infrastructures.
- Improve products, services, and resource supports to move the meter on equity and inclusion within the movement.
- Partner across affiliates, allied organizations, and open knowledge movement partners to bolster our movement efforts toward equity and inclusion across all languages, geographies, and demographic classes.
4. Tell us what you think
editAs we look to movement strategy and devise consistent metrics, how might these social climate factors help to guide the work you do? What, if any, additional questions come up for you in the context of your contributing communities? What excitements or concerns do the data bring for you related to the spaces you most often contribute? Tell us about it on the talk page!
References
edit- ↑ a b Tamm, J.; Luyet, & Thompson, R. & D. (2006). "Radical Collaboration: TLT Collaborative Skills Climate Survey™, Radical Collaboration. Retrieved online Aug 2016.". TLT Collaborative Skills Climate Survey™. Radical Collaboration. Retrieved Aug 2016.
- ↑ Kosciw, J. G.; Greytak, E. A.; Zongrone, A. D.,; Clark, C. M.; & Truong, N. L. (2018). "The 2017 National School Climate Survey". glsen.org. GLSEN. Retrieved May 2020.
- ↑ WestEd (2016). "California School Modules". WestEd for the California Department of Education. Retrieved August 2016.
- ↑ a b No author credited (2017). "6 Ways to Foster Belonging in the Workplace Taking Diversity & Inclusion to the Next Level" (PDF). Culture Amp. Retrieved October 2017.
- ↑ Croswell, A. (2020). "20 Employee Engagement Survey Questions Every Company Should Ask". Culture Amp. Retrieved May 2020.
- ↑ Corporate Leadership Council (2017). "Diversity Survey" (PDF). www.diversityresources.stlrbc.org. Corporate Executive Board. Retrieved October 2017.
- ↑ Society for Human Resource Management (2017). "Diversity Survey". www.shrm.org/. SHRM.org, California, USA. Retrieved Oct 2017.