Research:Editor lifecycle
| This page in a nutshell: This research is looking at the evolution of contributors activity over the years by analyzing statistical regularities in collective patterns of editing activity |
Topic
editHow does editor editing activity change over time? Are there any distinctive patterns of editing activity that could help explain long-term user participation, user retention, or user departure? If yes, have these patterns changed noticeably during the history of Wikipedia?
We know that early user activity is a good predictor for long term participation [1], but what is the general trend in the life cycle of a user after the first month? Here we use editing activity to pages as a general measure of user participation. We measure it as number of contributions per day. Activity is a less problematic measure than the activity span, i.e. the time elapsed between the first and the last edit of a user for two main reasons: first, users can take long break between active periods, and second, since Wikipedia is one of the most visited website on the Internet, and even though it is sometimes customary for Wikipedians to freeze their user page when retiring, it is likely for retired editors to edit long after they stop being active for reasons other than pure contribution, for example to respond to somebody on their talk pages. This means that the activity span may not reflect faithfully the actual period of activity of a user, which is instead better describe by editing rate.
This research is related to RQ9: "How are editing patterns changing?" of the main research question of the 2011 Summer of Research.
Process
editData collection
editGiven a registered user, the basic idea is to extract the time stamp of his/her revision history, compute the daily activity rate (in edits/day), and plot it. This estimate, however, is noisy due to the bursty nature of editing activity at the individual level (i.e. of single users), and to the natural variability of activity across users (i.e. some users are naturally more productive than others). To reduce the level of noise at the individual level, we compute the daily average rate of contributions of a user over a 30 days period, or over the total user lifespan, if the user's lifespan is less than 30 days. Next, we group users into homogeneous groups, which we call cohorts. Cohorts are formed in order to group together users who
- have similar productivity levels, and
- begin their participation period more or less at the same time.
In order to meet the second requirement, we bin users by month of their first edit.[2]. We further subdivide a given cohort by levels of activity. More details on this are given in the next section. Finally, since we want to study human contributors only, we also remove bot accounts (both those flagged and the known unflagged ones), and restrict to users with at least 2 edits with a lifespan longer than 1 hour.
Cohort composition
editAs we said, we group editors together into the same cohorts if they performed their first edit in the same period of time (i.e. same month), and if their total editing activity falls in the same range. Let us consider a user who did edits at times . His editing activity rate is defined as the total edit count divided by the total life span of activity, that is: . We call it the global activity level of that user, and we measure it in edits per second. As a reference value, a global activity of edits per second corresponds to edits in a month. We use logarithmic binning (base 10) to group editors together. So, our classes roughly corresponds to 2.5-25 edits/month, 25-250 edits/month, 250-2500 edits/month, etc.


We first explore how activity changes as the total edit count of users grows. The following plot of the editing activity versus total edit count reproduces a similar plot in the paper by Radicchi on human activity on the Web [3], which was obtained using a snapshot of the logging table from 2008.

This one is instead obtained from the contents of the revision table (all namespaces) of August 2011. In the plot, boxes stretch between the 25th and 75th percentile, whiskers correspond to the 10th and 90th percentile, and the line inside boxes represent the 50th percentile (i.e. the median). Users are binned logarithmically, but this time by total edit count. The plot shows that, roughly past , a linear relationship holds between number of edits and activity. However, if we take a given bin of activity greater than edits/sec, that is, if we set of a given interval on the -axis greater than edits/sec, we see that there are two categories of users, those with low edit counts, which therefore must have performed such edits in a relatively short time frame, and those with high edit counts, whose span of activity is considerably longer. This is consistent with the fact that the distribution of lifespan is bimodal [4].


Results and discussion
edit- You can follow my more or less up-to-date journal on its dedicated subpage. I will post new results there as a staging area. Eventually the material there gets moved to this page, as I sanity check my code and graphs.
Cohort trends
editWe extracted data from the Toolserver replica of the Wikipedia database. The daily editing rate is computed over one month (i.e. 30 days). All user histories are shifted in time so that the date of first edit of the account corresponds to the origin (i.e, ) of the -axis.


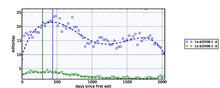
The first qualitative result is that editing activity evolves over time differently depending on user productivity. For low activity users ( edits/sec, roughly less than one edit per day), the peak of activity happens in the first 30 days--remember we are taking averages over 30 days periods -- presumably in the very first day. For high activity users (more than one edit per day), productivity peaks much later. For example, these are four cohorts from January 2006:

 |
 |


The dashed lines refer to a non-parametric fit performed with cubic splines. The smoothness factor was determined using cross-validation. The vertical lines mark the day of peak activity predicted by the spline model. For editors in the left plot, that is, cohorts with (in the legend of the plot the one marker as the " " cohort) and (the cohort) this day occurs after (roughly) 450 and 300 days. For the right plot, the peak of activity occurs in the first 30-days period. We can also see that at the tail of the curves in the right plot there is a surge in activity. This is likey due to the low number of editors over which the average activity is computed, and by the high variability of activity across editors at any given point in time.


We also tried parametric models and preliminary results suggest that the post-peak decay in editing activity by users with follow a stretched exponential law.

Community dynamics
editTo get an idea of how editor activity is changing from the inception of the English Wikipedia, we can plot, for each cohort, the date at which the peak of activity occurs, and the value of the peak. This plot gives us the evolution of productivity of users, broken down by productivity levels. The plots are shown below, on the top row. For high activity users with , (i.e. more than one edit per day), this shows that users are reaching their peak of activity earlier, and that when they do so, they are less productive than users with the same level of productivity who joined in previous years. For low activity users, the plot is not clear enough because almost invariably these groups have their peak of activity within the first 30 days, so the peak date in the graphs is always = 0. However, this doesn't give an clear picture of the dynamics at this range of activity.

We can however exploit the fact that activity follows a stretched exponential decay at this ranges of activity, and compute the mean relaxation time, that is, the characteristic time of decay in the activity for these groups. This is a measure of how much time it takes for the whole group to reach their baseline in terms of productivity. These plots show that even low productivity users are losing momentum faster than their counterparts from the earlier history of Wikipedia. The only notable exception to this is the group , which is fairly stable, meaning that participation at this (very low) level of activity is still fairly stable. This is probably related to the fact that editors in this group edit only occasionally and thus are not really affected by changes in the structure of the community.

 |
 |
 |
 |
 |
 |
 |


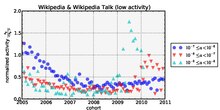
These plots suggest that there is an aging effect going on in Wikipedia, that is, the cycle of user participation is getting shorter as time passes, as editing activity for newer cohorts peaks earlier than in older cohorts. Another way to visualize this effect, comparing different ranges of activity, is to rescale the same curves displayed in the plots above by their average peak activity. In practice we take a given level of productivity, compute the peak activity for all the cohorts starting from the inception of Wikipedia, and divide these values by their average. This has the effect to rescale all values so that, for a given productivity group, the average value of the peak is equal to 1 (since we are dividing everything by that value!). In this way we can see how fast the slowdown is occurring at different levels of activity. The plots below are also broken down namespace, that is, we break down edit counts by namespace of destination and then proceed as usual with computing the average rates, fitting our non-parametric spline model, and finding the peaks. We report this break down for the following pairs of namespaces:
- all NS
- Main and Talk (NS: 0, 1)
- User and User_Talk (NS: 2, 3)
- Wikipedia and Wikipedia_Talk (NS: 4, 5)
To avoid clutter, we plot together high activity cohorts ( edits/sec) and low activity ( edits/sec):


 |
 |
 |
 |
 |
 |
 |
|
The first thing to note is that slowdown is not occurring uniformly over the whole range of activity: if we look at the peak dynamics for high activity user in all namespaces we see that the group are slowing down steadily, compared to the other two groups. This range of activity corresponds roughly to people performing between 25 to 250 edits per months, whereas people in the two other group do 10x and 100x that amount of edits. Similar trend hold when looking only at edits to namespaces Main and Talk.

For low activity classes ( ) we see yet different trends. The group doing between 2 to 25 edits/month seem to slow down whereas the classes of activity 10 and 100 time less active seem to not experience any notable slowdown--which is expectable, given that these users are just occasional users.

In conclusion, our technique let us understand how editing activity is changing over time in the whole community, and especially how this change is occurring for different groups of users: very active users seem to keep up with their pace essentially unchanged since the inception of Wikipedia, other groups, instead, seem to undergo shorter and shorter turnovers. These are important findings to understand how activity is changing over a stratified and heterogeneous community such as the English-speaking Wikipedia.
References
edit- ↑ Panciera et al. "Wikipedians are born, not made". in Proceedings of GROUP '09, 2009.
- ↑ We use the date of first edit instead of the date of account registration because the distribution of the lag between registration and first edit of users is skewed; about 30% of all registered users do their first edit several days after registration. Since cohorts are meant to bring together users who were active more or less during the same period, grouping by registration date might cause a substantial number of users to be assigned to the wrong cohort.
- ↑ Radicchi. Phys. Rev. E 80, 026118 (2009), DOI:10.1103/PhysRevE.80.026118
- ↑ Empirical Analysis of User Participation in Online Communities: the Case of Wikipedia Giovanni Luca Ciampaglia, Alberto Vancheri [full text]