コミュニティ資源/報告/助成金報告 2021年-2022年
| Funding report of the Community Resources Team for the 2021−2022 fiscal year | Report for 2022−2023 |
This report focuses on the funding distribution after the first year of implementation of the new funding strategy and grants relaunch in July 2021. Previous reports can be read here: 2020, 2021.
The goals of the new funding strategy were to align grants to the strategic direction, decentralize decision-making with a regional focus, increase funding and support to underrepresented communities, and provide support beyond funding, such as creating spaces for peer learning. The new funding strategy emphasizes learning, partnership and iteration which has informed our approach to reporting. This year we are developing three reports based on the information that we have collected. These reports will be used to engage in learning and sharing sessions with the Regional Fund Committees and grantee partners. The Community Resources team has gathered data and analysis and will release: 1. Funding distribution report, 2. Self reported programming and impact intentions by grantees, 3. Learning and feedback from grantees and Regional Funds Committees about the new strategy and necessary iterations and adjustments.
This Funding distribution report focuses on funds led by the Community Resources team which accounts for 93% of all the funding the Foundation distributes through grants. These funds are 1. Wikimedia Community Fund (including General Support Fund, Rapid Fund, and Conference Fund), 2. Wikimedia Alliances Fund, 3. Wikimedia Research and Technology Fund[1]. Other programs such as Movement Strategy grants, Wikimania, EduWiki, and other smaller funds were supported by teams such as Movement Strategy, Communications, Community Programs, and Partnerships[2]. In total there were 41 grants distributed with a value of $900,000.
The funding decisions for the Wikimedia Community Funds and Alliances Funds are carried out through the 7 volunteer-based Regional Funds Committees. This report is a recognition of their immense efforts and for learning, iterating, and adjusting with the Foundation and grantees to achieve greater equity, decentralisation, and overall impact.
The Community Resources team wants to acknowledge all of the grantees and applicants that have gone on this journey with us. Thank you for the openness to change, the patience as we continue to iterate and work together and the invaluable feedback you have offered to better understand your needs for moving our shared mission forward towards knowledge equity and knowledge as a service.
8 Key takeaways and data at a glance
- There was an increase in funding (51%) and grants (35%) in 91 countries, 20 more than last year. 82% of grants were approved, with 92% of the requested funding approved. The efforts and partnership between Regional Funds Committee members, grantees, and Program Officers offering support closer to the regions, have been key in achieving these results.
- There was an increase in a more equal distribution amongst regions, whilst maintaining growth in the funding distributed in all regions.
- Regions that most grew in terms of funding were MEA (149%) and ESEAP (135%) regions, whilst the South Asia region saw a slight decrease in the percentage of funds going to this region. Working with affiliates and partners in South Asia to build trust and face administrative barriers will be key to support communities in the region.
- There has been a marked increase in funding to emerging communities (128%) and to middle and lower-income countries (70%). There are opportunities to grow here, particularly in countries that are underrepresented in the Movement, taking into consideration their internet use and readership. Language accessibility and outreach will be key, as they proved to be important aspects in diversifying the group of newcomers in the last year.
- There are opportunities for the growth of specific funds in each region and to increase the number of Rapid Fund grantees transitioning to more General Support Funds that allow for longer-term planning and stability, but also increased programmatic scope. Also, opportunities to bring in newcomers and partners through the growth of Alliances, Research, and Rapid Funds in various regions where today they are underrepresented.
- 7 of the top 10 countries funded are in NWE, Nigeria is the 2nd, and Indonesia the 5th.
- There has been a significant increase in new grantees (40%) and the percentage of funding going to new grantees (160%).
- The new funding structure has started to diversify the entry points for new grantees and those transitioning from smaller rapid and former project grants. 17% of all General Support grants are new, 9-% in the Alliances Fund and all Research Fund Grantees. 21% of General Support grantees transitioned from the Rapid Fund.
Rapid funds now receive larger General Support Funds
General overview
During the 2021–2022 fiscal year, the Wikimedia Foundation Funds awarded 491 grants, this is a 35% increase from 2021 (364). This includes 14 multi-annual grants. This signifies a 51% increase in funding in comparison to last year, going from 8.2 million in funding to 12.4 million. This increase does not include the resources approved in multi-year funds for years 2 and/or 3. The total funding distributed is 17.6 million if we include the amounts approved for year 2 and/or 3.
The funding was distributed in 91 countries, 20 more than in 2021[4], several of which are in underrepresented regions. 14 multi-annual grants were approved and distributed in 6 of the 7 regions.
Technical Note:
- The analysis in this report does not include the funds distributed for subsequent years of multi-year funds so that it is possible to compare the funds distributed on a yearly basis in each fiscal year.
- The historical analysis for this report includes data from 2015, as grants programs are more comparable from this year onwards.
- The historical data from previous reports may differ from previous reports, given that previous reports included all Wikimedia grants. This more detailed analysis is only for Funds operated by the Community Resources team.
リソースの配分
補助金プログラムと資金配分
-

-
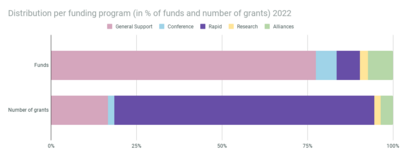 受給対象事業ごとの資金配分(%)

_2022.png)
General Support Fund (82 grants): 77% of the Funds were invested in the General Support Fund with an average funding of $117,000 per grant, varying between $9,500 to $500,000. 87% of grants go to applicants that are registered as organisations.
Rapid Funds (363 grants): 7% of funds are invested in Rapid Funds distributed in a large number of grants, averaging $2250 per grant. 85% go to applicants that register as individuals.
Conference grants (9 grants): 6% of funding is invested in conference funds averaging $83,000 per grant, with little variation in the grantsize. 100% go to registered groups or organisations.
Research Funds (8 grants): An average $32,500 per grant, with some variation between individuals with smaller grants (under $10,000) and others with more than $40,000. 5 out of 8 are individual research grantees, 2 are organisations, and one is a Wikimedia user group or affiliate. 55% of funding goes to applicants that are registered as individuals.
There has been an important increase in the number of grantees over time. The new funding strategy has enabled more affiliates of different sizes to access funding to support their general programs, as well as allowed diverse entry points for newcomers through the different funds.
.png)
地理的な配分
-
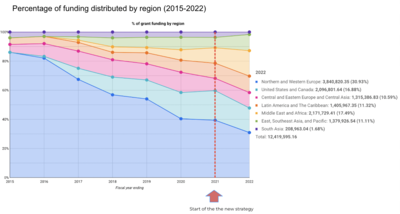 資金配分の地域単位の比較(調整値%、ウィキメディア補助金支給地域単位)
 -
 資金配分の地域単位の比較(調整値、ウィキメディア補助金支給地域単位)


With the relaunch of the Foundation Funds strategy, we have seen a marked increase in funding to regions that have historically received less funding. As graph 1 shows, this was already a growing tendency, and has accelerated in the last year, as a result of the new Regional Funds Committees, regional budget allocations, new criteria to receive funding, proactive outreach, and support closer to applicants’ contexts, languages and needs.
In 2021 40% of funds were going to non-US and NWE regions and now it is 52%[5]. This has not meant a decrease in absolute funding to these regions, this has grown by 18% (NWE) and 25% (USCA).

As highlighted in the graph below, there is a greater distribution among regions in terms of percentage of funding, however, the distribution in terms of the number of grants is different. 66% of grants (in terms of the number of grants) are concentrated in the MEA region, which indicates that these funds are generally being distributed amongst more countries and grantees.

In these graphs, it is possible to see how the absolute amount of funding and participation has grown in comparison to 2021.
.png)

In the past year, the region that has most grown in terms of funding distribution is the MEA region. In terms of funding, this has meant a 148% increase in USD allocated. This is followed by the ESEAP region with a growth of 135% in USD allocated.
It is interesting to note the differences in regional distribution per type of fund which can indicate ongoing challenges for regional distribution.
For Rapid Funds, in 2022, 77% are distributed in the MEA region, and most of the other regions account for approximately 4% respectively. Given that this is an important entry point for newcomers, there is an opportunity for growth of this fund in other regions, particularly LAC, ESEAP, and South Asia.
Conference Funds are more evenly distributed, ESEAP and NWE with slightly higher participation. After two years of COVID related restrictions, it is natural that in the next year we expect to see growth in most regions, as grantees seek more interregional connections through conferences. It is interesting to note a growing tendency in thematic conferences with more global participation. Likewise, after Covid, there is an increased interest in community growth and building, as well as investing in services to facilitate diverse newcomers, such as hybrid events and translation services.
Alliances Fund has signified an opportunity for growth in the ESEAP region, accounting for 30% of these funds. There are opportunities to grow in other regions such as South Asia, MEA and CEE.
62% of the Research Funds are distributed in NWE and USCA regions, indicating an opportunity for further outreach with potential research grantees in other regions as this fund evolves after its initial year. There were applications from 22 countries in all funding regions. The 8 approved grants are in 7 countries in 5 regions. Several of these grantees are pursuing work that will increase our understanding of non-English Wikipedia communities, how the resources are used, and how we can facilitate translation of articles into many languages to make them more globally accessible. Projects also have the potential to directly impact Wikipedia contributors in line with the 2030 Strategic direction. In particular, funded research will inform responses to vandalism, training of new editors, and handling of articles for deletion (AfD) cases.
35% of General Support Funds are distributed in the NWE region, followed by 17% in USCA. There is an opportunity for further growth in participation in other regions, with Rapid Grantee partners transitioning to General Support Funds, or by doing outreach with 59% of affiliates that have not yet accessed these funds (74 affiliates out of 177 registered affiliates are currently accessing grants).
There are opportunities to grow in regions that today that have high level of internet use and are still underrepresented in the movement in comparison- particularly the LAC, MEA, ESEAP, and SA regions.
Given that 77% of funding goes to the General Support Fund, it is interesting to look at some data on regional differences. Whilst funding within regions varies, it is interesting to look at the average General Support Fund per region and what challenges and opportunities this presents for the future.
The average funding in the General Support Fund is $117.000 USD per grant. In MEA, CEE, and South Asia the average is almost half this amount between $55,000-70,000[6]. In NWE and USCA regions it is $210,000-240,000. This is understandable given the history of funding, affiliates’ experience, and also country-costs[7]. When adjusted for country-costs the difference is smaller, but MEA, CEE, and South Asia are still around 35% below average. This does not imply that all regions should grow in the same ways, but it indicates opportunities for grantees and communities in each region to think about how best to distribute funds given different levels of development growth opportunities and needs.
国t・地域の配分比較
In the top 7 countries receiving funds, 4 are in NWE. Nigeria is the 2nd country in terms of funding distribution with 5.1% of funding and Indonesia is 5th with 3.8% (Annex 1). If we look at the number of funds the country list changes significantly given the number of Rapid Funds in the MEA region. 4 of the 7 countries are in the MEA region[8]. The 1st ranking country is Nigeria with 174 grants.
Nigeria receives 42% of funding going to Rapid Funds globally. While there are larger General Support Funds awarded to affiliates, groups and individuals in the country, this high number of smaller rapid funds results in a lower grant average of funds awarded in the country. An ongoing challenge is making sure that these efforts are coordinated and where relevant, transition into long term strategic funding that contributes to sustainable community infrastructure and cohesion.
Distribution within regions: There is variation in funding distribution within a region. This relates to the presence of affiliates with more experience within the Movement and the types of funds they have historically accessed, and can also give insights into countries where efforts can be made in the future. It also gives an indication of the level of geographical diversity and distribution within regions.
This analysis should not be taken as a value judgment of regions, as each has had different levels of community development and growth over time. It is meant to highlight regional variations and opportunities that can be discussed with each region.
- NWE: 16 countries funded. Funding in NWE is quite evenly distributed within the 16 countries funded. France, UK, Netherlands, Israel and Sweden receive 63% of the (between 10-15% each).
- CEE: 19 countries funded. There is also quite an even distribution across countries, with 8 of these receiving around 60% of the funds.
- MEA: 31 countries funded. 43% of the funding in the region goes to Nigeria and Ghana. Followed by South Africa, UAE, Tanzania and Ivory Coast with 6-9% of the funding each. 16 countries receive less than 2% of the funding in the region, mostly through Rapid Funds. It is worth noting the growing participation of francophone countries in the MEA region, due to more language accessibility, outreach, and activism in these communities. This also indicates opportunities to do outreach with other language communities in the region.
- LAC: 3 countries Brazil, Argentina, and Mexico receive 66% of the funds. 5 countries receive between 4-10% each, and 2, Venezuela and Honduras, receive less than 1% each. It is also worth noting that language accessibility and outreach efforts also facilitated the participation of the first Caribbean and francophone country to receive funding.
- SA: 98% of the funds are concentrated in India, and 62% of the funds are in 1 organisation.
- ESEAP: 12 countries funded in the region. 68% of funds are concentrated in 2 countries, Indonesia and Australia.
- USCA: being a region of only 2 countries the analysis varies. 88% of the funds are concentrated in the United States. 88% of funding within the US is quite evenly distributed, between 6 grantees with a history of funding, several of whose work has a more global scope, such as Wiki Education Foundation, Whose Knowledge, and Art+Feminism.
There is some variation in the distribution of funds within regions. In USCA, NWE and CEE with a concentration of larger affiliates with a long history of grants – the intra-regional distribution is more even. In SA,MEA, LAC and ESEAP this vatiation is wider with few grantees concentrating a larger percentage of funding due primarily to have a longer history and larger organizational structure.
収入階層ならびに「新興コミュニティ」と資金配分
The Foundation, particularly the GDI team, is working on more robust definitions to define measurements for “equity” and how we can consider these variables in funding analysis. Whilst this is being developed, and continuing with previous years' analysis, we have used the World Bank classification of country income levels and the “emerging communities” classification developed by the Foundation some years ago.
世界銀行標準に照らした収入階層
We are continuing to close the gap between the funds distributed to higher income countries, vs non-high income countries. This is a trend that has been happening over the last 8 years and accelerated in the last year within the fund's strategy. There was a 33% decrease in the disparity between funding for high-income vs non-high income countries in the last year.
In 2022, 61% of funding was going to high-income countries, in 2021 it was 67%. This varies if you consider the type of fund. For instance, 77% of Research Funds are distributed to higher-income countries, 65% of General Support funds, and only 13% of Rapid Funds.

As with regional distribution, this shift has not meant that high-income countries received fewer funds, in fact, there was a 38% increase in funding for high-income countries. It is important to note that increased investment in World Bank ``high-income” countries is not a negative trend if we consider that this group includes many countries that today are “underrepresented” in terms of editorship and readership in comparison to internet use, and where it would be positive for the Movement to grow or foster new communities. For instance, countries like Uruguay and Chile in LAC, Taiwan, Japan, Australia, New Zealand in ESEAP, and the United Arab Emirates in the MEA region.
There has not only been an increase in the percentage of funds going to Non-high income countries (from 31% in 2021 to 38% in 2022), but also in the number of funds. There was a 70% increase in funds to Upper middle and lower-middle countries. Non-high income countries receive 79% of grants (in terms of the number of grants).
As can be seen in the graph below, there is a higher distribution to lower middle and low-income countries if we consider the number of grants, which reflects the number of Rapid Funds, mostly in the MEA region.

新興コミュニティ
In 2021 36% of funds went to emerging or least developed communities, in 2022 it is 50%, in large part to targeted efforts to share funding opportunities with countries in these groups.
This has implied a 128% increase in terms of the absolute value of funds.
Rapid Funds continue to be an important entry point for lower-income countries, particularly from the MEA region.
Across all regions, 33% of Rapid Funds go to lower-income countries, compared to 17% for General Support, Alliances, and Research Funds.
At the same time, there are opportunities to continue to grow in non-high income countries, particularly those that today are more underrepresented according to growth potential from GDI (some examples are Guatemala, Paraguay, Mozambique, Yemen, Uzbekistan, Pakistan, and Vietnam.)
Rapid Funds could be more widely promoted to other regions where we want to bring in new grantees and strengthen emerging communities or affiliates that have not yet accessed grants in the past. At the same time, it is important to continue to work with repeat Rapid Fund grantees to transition to General Support Funds. This year 35% of General Support grantees in MEA transitioned from receiving Rapid Funds.

新規受給者にとって機会か
There was an increase in new grantees between 2021 and 2022, from 116 to 163, representing 53% of unique grantees[9]. Beyond the number of grants, there has been a 160% increase in funds invested in new grantees.
As highlighted in the 2021 report, historically it has been harder for new grantees or those receiving Rapid Funds to transition to larger annual funding. The new funding structure is starting to diversify the entry points for new grantees. In the former grants programs, most new grantees entered through Rapid Funds or project grants (and only 2 through an annual plan or conference grants in NWE and MEA). The new system has allowed for a wider variety of grantees in all regions through the new funds.
77% of new grantees in 2022 still entered through Rapid Funds, however, 6% of new grantees entered through General Support grants, 10% Alliances Fund grantees, 5% Research, and 1% Conference grantees.
The General Support Fund has been open to grantees applying for the first time, as well as those transitioning from other funds. 17% of all General Support grants are new, 42% of which come from the MEA region followed by the LAC region (29%). In the SA, USCA, and CEE regions as there were few or no new grantees accessing this fund, signaling an opportunity for outreach here. The General Support Fund has also been a good entry point for those transitioning from smaller funding programs. 21% of General Support grantees transitioned from Rapid Funds, allowing them to significantly increase their access to funding.
Naturally, because it is a new fund specifically open to bringing in mission-aligned organisations, the Alliances Fund welcomed newcomers working with Wikimedia communities, particularly in the ESEAP, USCA, and LAC regions. Whilst the Research Fund grants were awarded primarily in NWE and USCA (in terms of % of funds distributed), it has incorporated new grantees in almost all regions, except for South Asia. Conference Funds are also an opportunity to include new grantees, this will probably be incentivised as we move out of Covid-related restrictions and organisations seek to create more cross-regional hybrid events.
There is a variation in the average fund per new grantee between regions. Whilst the grant value varies per program the average fund for all new grantees in most regions is $20,000, whilst in the South Asia and MEA regions, it is $3,000-4,500. Beyond issues such as the cost of living or grant experience, it is important to review if there are any barriers that imply inequity for newcomers in different regions, such as, the lack of organizational infrastructure, more rigorous review criteria and processes, including community review and feedback.


提携団体にとって機会か
2022年時点で、承認すみ提携団体177件のうち助成金受給者は74件です(41%)。地域ごとに受給者総数に占める提携団体の割合には差異があります。高位を占めるESEAP地域では域内の提携団体の70%が助成対象、ついでLAC(67%)、NWE(56%) MEA(56%)の順です。いずれの地域にも伸長の機会はあり、それでも提携団体の受給率が比較的低いUSCA(33%)、CEE(47%)に加えて南アジア(SA=14%)の諸地域ではなおさらその予測が立ちます。背景にアメリカ合衆国と南アジア、中東とアフリカ地域で助成金受給に規制がある点から、提携団体に資金援助ができない構造、利用者グループの活動停滞には、提携団体委員会ならびに財団各チームとの協働により、これらの対象群に普及活動を広げて助成事業の可能性を探る余地はあると考えます。さらにまた、前年度の受給者で提携団体だったところは22件ですが、2022年の受給組織ほど直接的な資金投資ではなかった点に触れておきます。過年度の助成金配分はすべての地域を対象とし、重点はCEEと南アジアに置きました。理由はいくつかあります。3件はSAと MEAならびにCEEで助成金授受に規制があったため、2件は受給者内部の法的な課題のため、3件は予算執行年度に新たな資金の手当てが不要で受給申請は将来の年度に実施する計画を立てていたため、また事案の1件では提携団体の参加者が助成金の着金窓口となり、定型団体の直接の申請ではありませんでした。もしもその他の障壁が過去の受給申請者の側に存在し、制度変更によってそれを評価し理解することは有意義と思われます。
個別受給者に対する提携団体が占める割合は24%です。しかしながら個人もしくは未承認のグループが受給者である場合も、提携団体との密接な関係もしくは強く結びついた活動をしている割合が大きい点は重点として認識しておくとよいでしょう[10]。
支給承認の割合
82% of grants were approved out of the 605 applications[11]. 24 grants were still under the process of Committee or grants admin review by the end of the fiscal year. Of the 90 grants declined, 83% (75) were rapid grants, 9% (8) Alliances Funds, and 8% (7) General Support. The reasons why some proposals were declined vary according to the program and region. In the case of Rapid Funds, the main reasons were that the individuals or groups were not eligible and also because of the incomplete proposals, capacity to implement the programmatic proposals, or a limited impact for the funds requested.
A few of the General Support Funds were because they were not eligible through the specific fund[12], but most of them were because their scope should be reviewed and adjusted in future rounds. In the case of Alliances Funds, a few proposals were declined because of budget limitations in each region. In other cases because the organisation’s proposal was not sufficiently aligned to Wikimedia projects or in partnership with existing Wikimedia communities in their context.
ここで脚光を当てておくなら、受給者が申請した総額は92%が承認されているという点をあげることができます。事実、一般支援基金においては支給対象事業に資すると判断し、当初申請額に対し支給額がうわまわる事例も12%を占めます。
Regional Funds Committees and Program Officers will continue to seek ways to best support applicants whose proposals were declined or not fully funded so that they can further develop their proposals in future rounds.
これはともにたどる旅程のような取り組みです
This funding report will continue to evolve and improve as well as be integrated with the other two reports on self reported programming and feedback from applicants and regional fund committees. We want to give an enormous amount of gratitude and recognition of the work of Regional Committee members that have dedicated their time and thought partnership over the last year to support growth in their regions. To all of the applicants and grantees, new and returning, Wikimedians and partners, who have dedicated innumerable hours of work to develop their proposals, navigated through changes in the funding strategy and tools, and are the champions of turning this funding into Free Knowledge in the world.
皆さんには3回すべての報告書の提出をお願いしており、受給者が目指すプログラムを掘り下げ、その目指す波及効果をより深く把握するためでもあり、新規の助成金戦略に忌憚のないフィードバックをお寄せいただくためでもあります。
これはともにたどる旅程のような取り組みであり、進みながら学んだり調整したりしていきます
Annexes
Annex 1: Distribution of funds by geography
| 受給者の国・地域 | Percentage by amount 2022 | 助成対象企画数 | 1年単位の助成金総額(USD) | 個別の助成金の平均額(USD) |
|---|---|---|---|---|
| United States of America | 14.26% | 23 | 1,771,442.6 | 77,019.2 |
| Nigeria | 5.10% | 175 | 632,786.1 | 3,615.9 |
| France | 4.57% | 3 | 568,145.7 | 189,381.9 |
| United Kingdom | 4.51% | 3 | 560,500.8 | 186,833.6 |
| Indonesia | 4.28% | 4 | 531,498.3 | 132,874.6 |
| Austria | 3.76% | 3 | 466,925.1 | 155,641.7 |
| Netherlands | 3.60% | 2 | 446,945.3 | 223,472.7 |
| Australia | 3.40% | 3 | 421,702.0 | 140,567.3 |
| Israel | 3.28% | 1 | 406,978.1 | 406,978.1 |
| Sweden | 3.21% | 4 | 398,288.5 | 99,572.1 |
| Brazil | 2.91% | 9 | 361,671.4 | 40,185.7 |
| Argentina | 2.83% | 3 | 351,428.0 | 117,142.7 |
| Ghana | 2.76% | 40 | 343,341.7 | 8,583.5 |
| Taiwan | 2.27% | 8 | 281,426.2 | 35,178.3 |
| Canada | 2.14% | 6 | 265,359.0 | 44,226.5 |
| Norway | 1.93% | 1 | 239,925.0 | 239,925.0 |
| Mexico | 1.88% | 2 | 233,370.0 | 116,685.0 |
| Spain | 1.81% | 3 | 224,804.8 | 74,934.9 |
| South Africa | 1.77% | 2 | 220,264.1 | 110,132.0 |
| India | 1.65% | 12 | 205,422.3 | 17,118.5 |
| United Arab Emirates | 1.65% | 2 | 204,601.5 | 102,300.8 |
| Finland | 1.59% | 3 | 197,652.4 | 65,884.1 |
| Czech Republic | 1.50% | 1 | 185,960.3 | 185,960.3 |
| Chile | 1.18% | 2 | 146,447.7 | 73,223.8 |
| North Macedonia | 1.16% | 3 | 143,610.9 | 47,870.3 |
| Ukraine | 1.12% | 1 | 139,102.3 | 139,102.3 |
| Tanzania | 1.09% | 17 | 135,072.5 | 7,945.4 |
| Serbia | 1.05% | 1 | 130,877.2 | 130,877.2 |
| Ireland | 1.02% | 2 | 127,100.5 | 63,550.3 |
| Ivory Coast | 1.02% | 4 | 126,401.5 | 31,600.4 |
| Turkey | 0.89% | 3 | 110,863.0 | 36,954.3 |
| Estonia | 0.88% | 2 | 108,756.2 | 54,378.1 |
| Poland | 0.85% | 2 | 106,131.4 | 53,065.7 |
| Germany | 0.83% | 5 | 102,687.1 | 20,537.4 |
| Italy | 0.72% | 2 | 89,538.8 | 44,769.4 |
| Uruguay | 0.69% | 1 | 85,515.0 | 85,515.0 |
| Cameroon | 0.68% | 6 | 84,548.2 | 14,091.4 |
| Colombia | 0.66% | 2 | 82,023.7 | 41,011.9 |
| Tunisia | 0.60% | 4 | 75,036.9 | 18,759.2 |
| Portugal | 0.57% | 4 | 70,342.8 | 17,585.7 |
| Peru | 0.56% | 1 | 69,852.5 | 69,852.5 |
| Mozambique | 0.54% | 3 | 66,444.6 | 22,148.2 |
| South Korea | 0.52% | 1 | 64,156.9 | 64,156.9 |
| Armenia | 0.49% | 3 | 61,430.0 | 20,476.7 |
| Haiti | 0.48% | 2 | 59,960.0 | 29,980.0 |
| Uganda | 0.38% | 1 | 46,867.0 | 46,867.0 |
| Rwanda | 0.37% | 7 | 46,525.0 | 6,646.4 |
| Belgium | 0.37% | 1 | 45,360.0 | 45,360.0 |
| Romania | 0.31% | 3 | 39,006.8 | 13,002.3 |
| Bosnia and Herzegovina | 0.31% | 1 | 38,895.8 | 38,895.8 |
| Malta | 0.31% | 2 | 38,478.7 | 19,239.4 |
| Morocco | 0.29% | 1 | 35,614.0 | 35,614.0 |
| Albania | 0.27% | 1 | 34,114.5 | 34,114.5 |
| Jordan | 0.27% | 2 | 33,947.0 | 16,973.5 |
| Georgia | 0.26% | 1 | 32,475.0 | 32,475.0 |
| Benin | 0.25% | 10 | 30,702.6 | 3,070.3 |
| New Zealand | 0.24% | 1 | 29,479.0 | 29,479.0 |
| Guinea | 0.22% | 5 | 27,915.3 | 5,583.1 |
| Botswana | 0.22% | 3 | 27,815.2 | 9,271.7 |
| Malaysia | 0.14% | 1 | 17,550.0 | 17,550.0 |
| Democratic Republic of the Congo | 0.14% | 6 | 16,911.2 | 2,818.5 |
| Thailand | 0.14% | 1 | 16,863.1 | 16,863.1 |
| Kenya | 0.12% | 7 | 14,604.8 | 2,086.4 |
| Burundi | 0.11% | 6 | 13,744.0 | 2,290.7 |
| Venezuela | 0.10% | 2 | 12,320.4 | 6,160.2 |
| Croatia | 0.09% | 4 | 11,756.5 | 2,939.1 |
| Russia | 0.09% | 4 | 11,188.9 | 2,797.2 |
| Philippines | 0.09% | 4 | 10,703.1 | 2,675.8 |
| Austria | 0.08% | 1 | 9,565.0 | 9,565.0 |
| Chad | 0.07% | 3 | 8,524.7 | 2,841.6 |
| Mali | 0.06% | 3 | 7,813.8 | 2,604.6 |
| Sudan | 0.05% | 2 | 6,310.0 | 3,155.0 |
| Greece | 0.05% | 2 | 6,167.9 | 3,083.9 |
| Zimbabwe | 0.05% | 3 | 5,650.0 | 1,883.3 |
| Hong Kong | 0.03% | 1 | 4,258.0 | 4,258.0 |
| Namibia | 0.03% | 1 | 4,010.0 | 4,010.0 |
| South Sudan | 0.03% | 2 | 3,650.0 | 1,825.0 |
| Bangladesh | 0.03% | 2 | 3,540.7 | 1,770.4 |
| Honduras | 0.03% | 1 | 3,378.6 | 3,378.6 |
| Zambia | 0.03% | 1 | 3,166.0 | 3,166.0 |
| Republic of the Congo | 0.02% | 1 | 3,050.0 | 3,050.0 |
| Lebanon | 0.02% | 1 | 2,000.0 | 2,000.0 |
| Oman | 0.02% | 1 | 1,980.0 | 1,980.0 |
| Togo | 0.01% | 1 | 1,505.0 | 1,505.0 |
| Hungary | 0.01% | 1 | 1,461.7 | 1,461.7 |
| Japan | 0.01% | 1 | 1,006.0 | 1,006.0 |
| Senegal | 0.01% | 1 | 926.8 | 926.8 |
| Vietnam | 0.01% | 1 | 784.0 | 784.0 |
| Belarus | 0.01% | 1 | 650.0 | 650.0 |
| Slovenia | 0.00% | 1 | 520.3 | 520.3 |
| Cambodia | 0.00% | 1 | 500.0 | 500.0 |
脚注
- ↑ This is the first year the Research Fund has operated. The Technology component is still to be launched with the necessary support from the Foundation teams working in this area.
- ↑ Eduwiki 6 grants ($78k), Movement Strategy 12 grants (Special:MyLanguage/Grants:Programs/Wikimedia Alliances Fund82K), WMF initiatives 7 grants (438K), Wikimania 16 grants (54K).
- ↑ Historical data has been adjusted to the Wikimedia Funds regions. To review the countries included in each region you can click on the links below. The regional acronyms will be used throughout this report.
- ↑ New countries in 2022: Bangladesh, Bosnia and Herzegovina, Burundi, Cambodia, Honduras, Hungary, Jordan, Lebanon, Mali, Mozambique, Namibia, Oman, Russia, South Sudan, Thailand, Togo, Vietnam, Zambia, Zimbabwe. Funds were distributed through a new Alliance Fund.
- ↑ In the past, community members have asked us to analyse some of this data considering the different costs of living in countries and regions. The World Bank traditionally uses the concept of purchasing power parity. It is interesting to note that if we consider this adjustment, there we are managing to close the gap further in terms of distribution amongst regions, with 72% of the funds (adjusting the USD to the purchasing power) going to regions outside of the US+Canada and NWE.
- ↑ This does not imply that within these regions there are no larger funds. The fact that the average is lower also indicates some level of concentration of funds within the region, with 1 or 2 grantees receiving larger funds and several others much smaller amounts.
- ↑ Using PPP adjustment described in the technical note.
- ↑ These are Nigeria, Ghana, United States, Tanzania, India, Benin, and Brazil.
- ↑ This is calculated using the number of unique grantees (307) not the number of grants (491), not counting new grantees that accessed more than one grant.
- ↑ 2022年分の詳細な分析はまだですが、承認済み提携団体が全体に占める割合の正確な数値は今後の報告書にて公表できる見込みです。
- ↑ This includes some grants that were withdrawn.
- ↑ For instance the CEE hub proposal that was to be funded through Movement Strategy Grants.